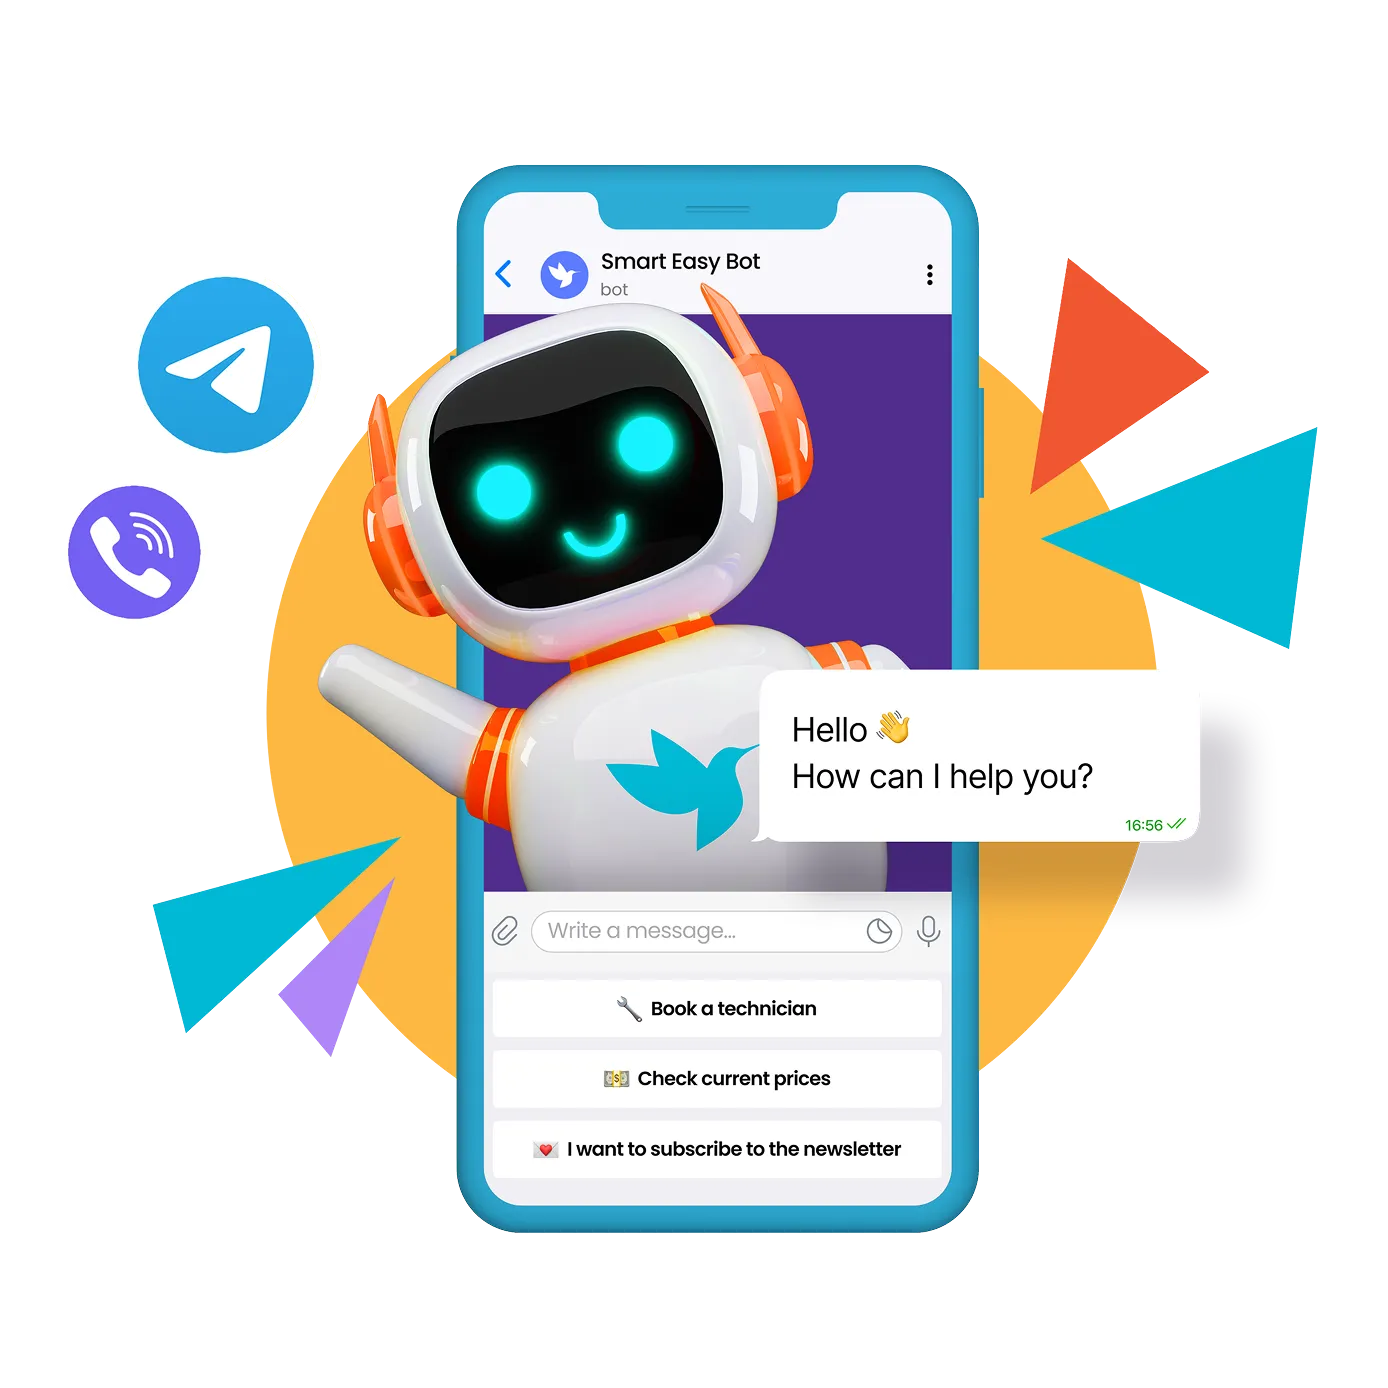


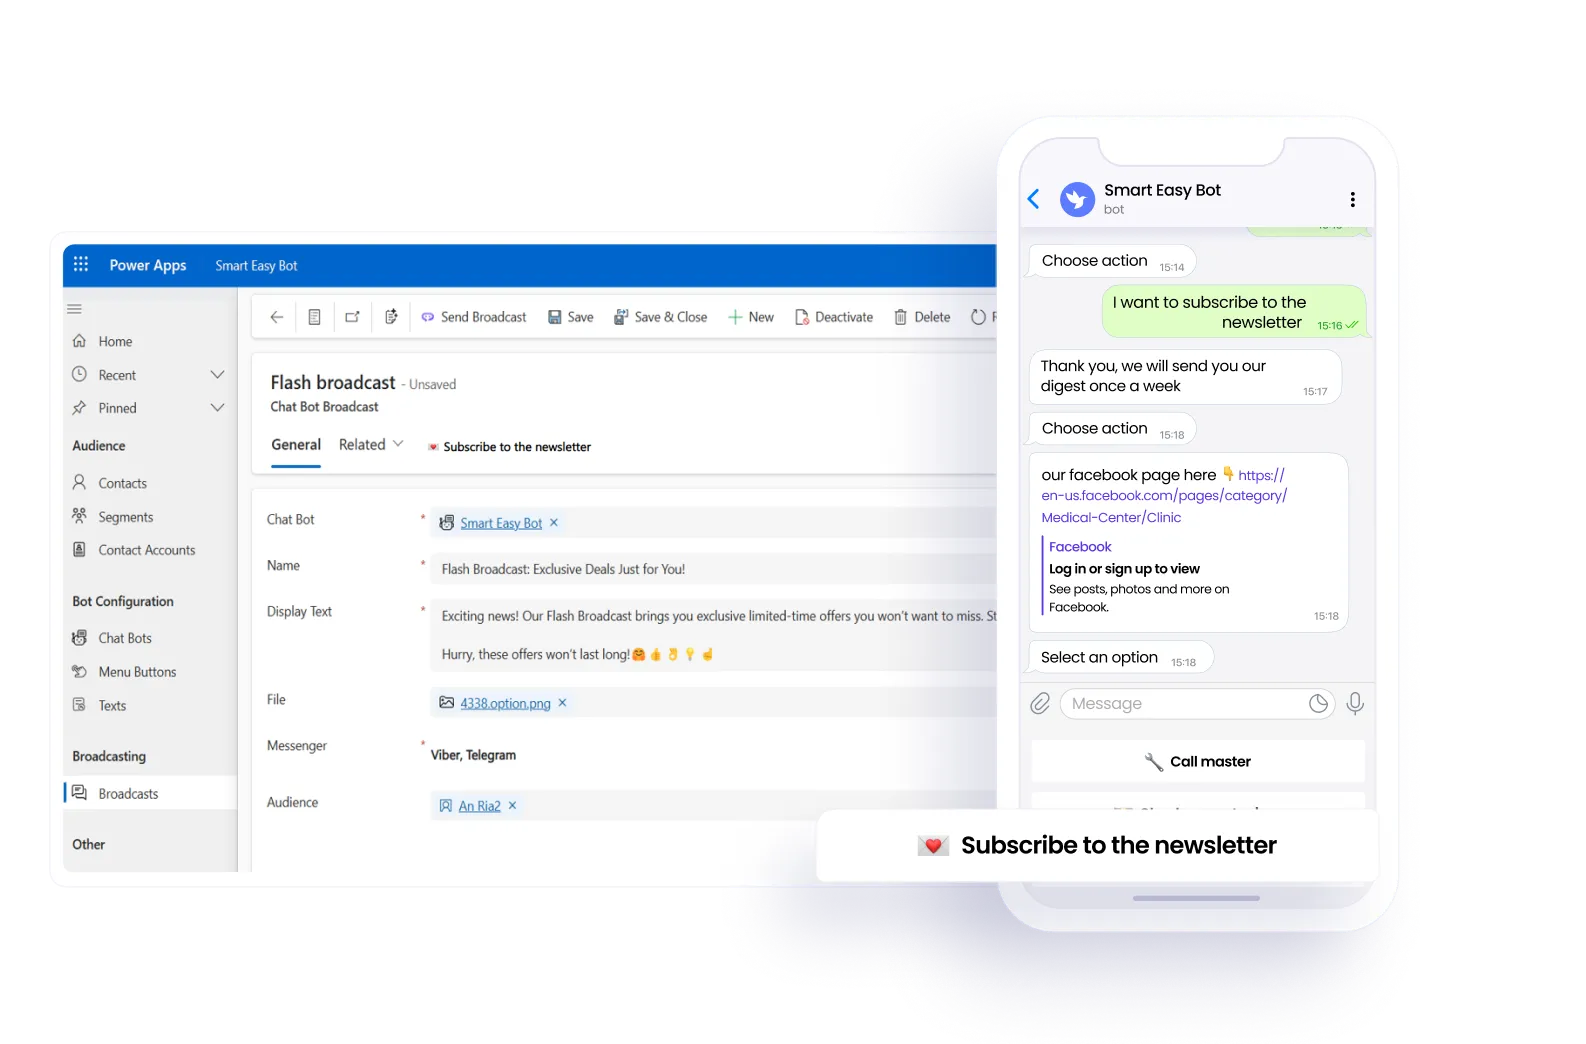
Send messages to all active chatbot subscribers, set up segment-based interactions, and communicate with individual users.
Interface available in three languages: Ukrainian, English, and Polish.
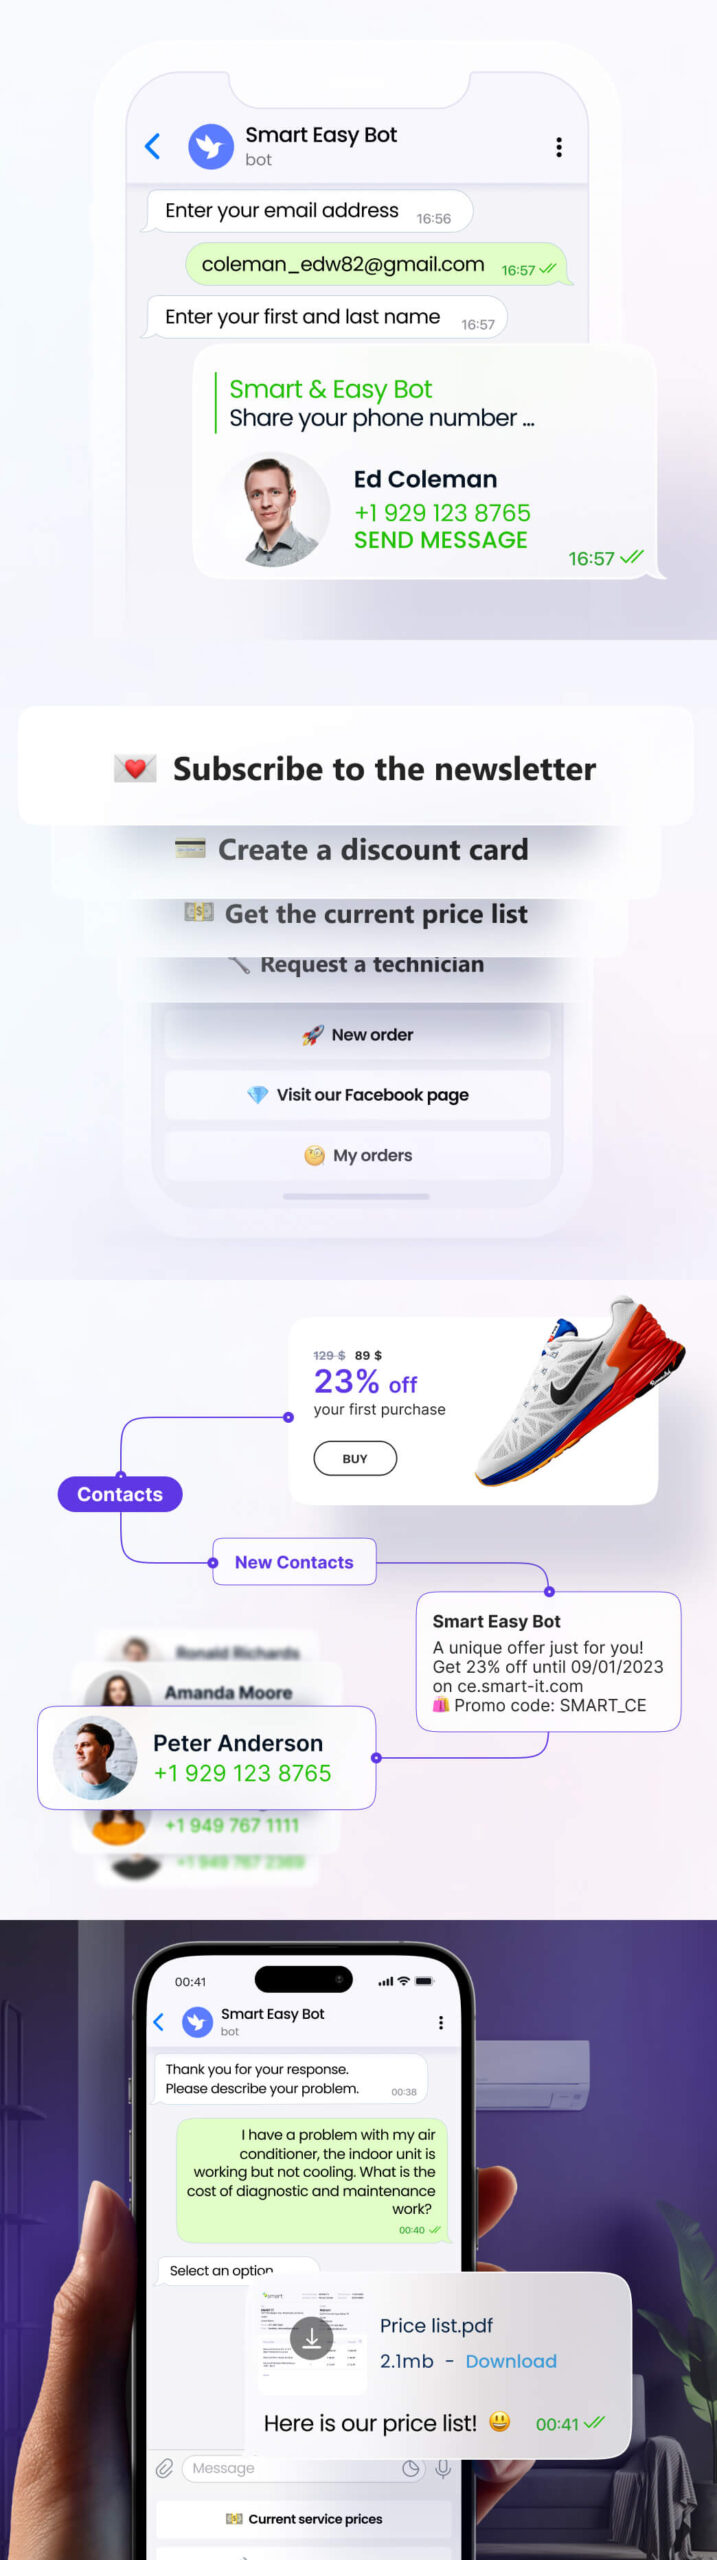
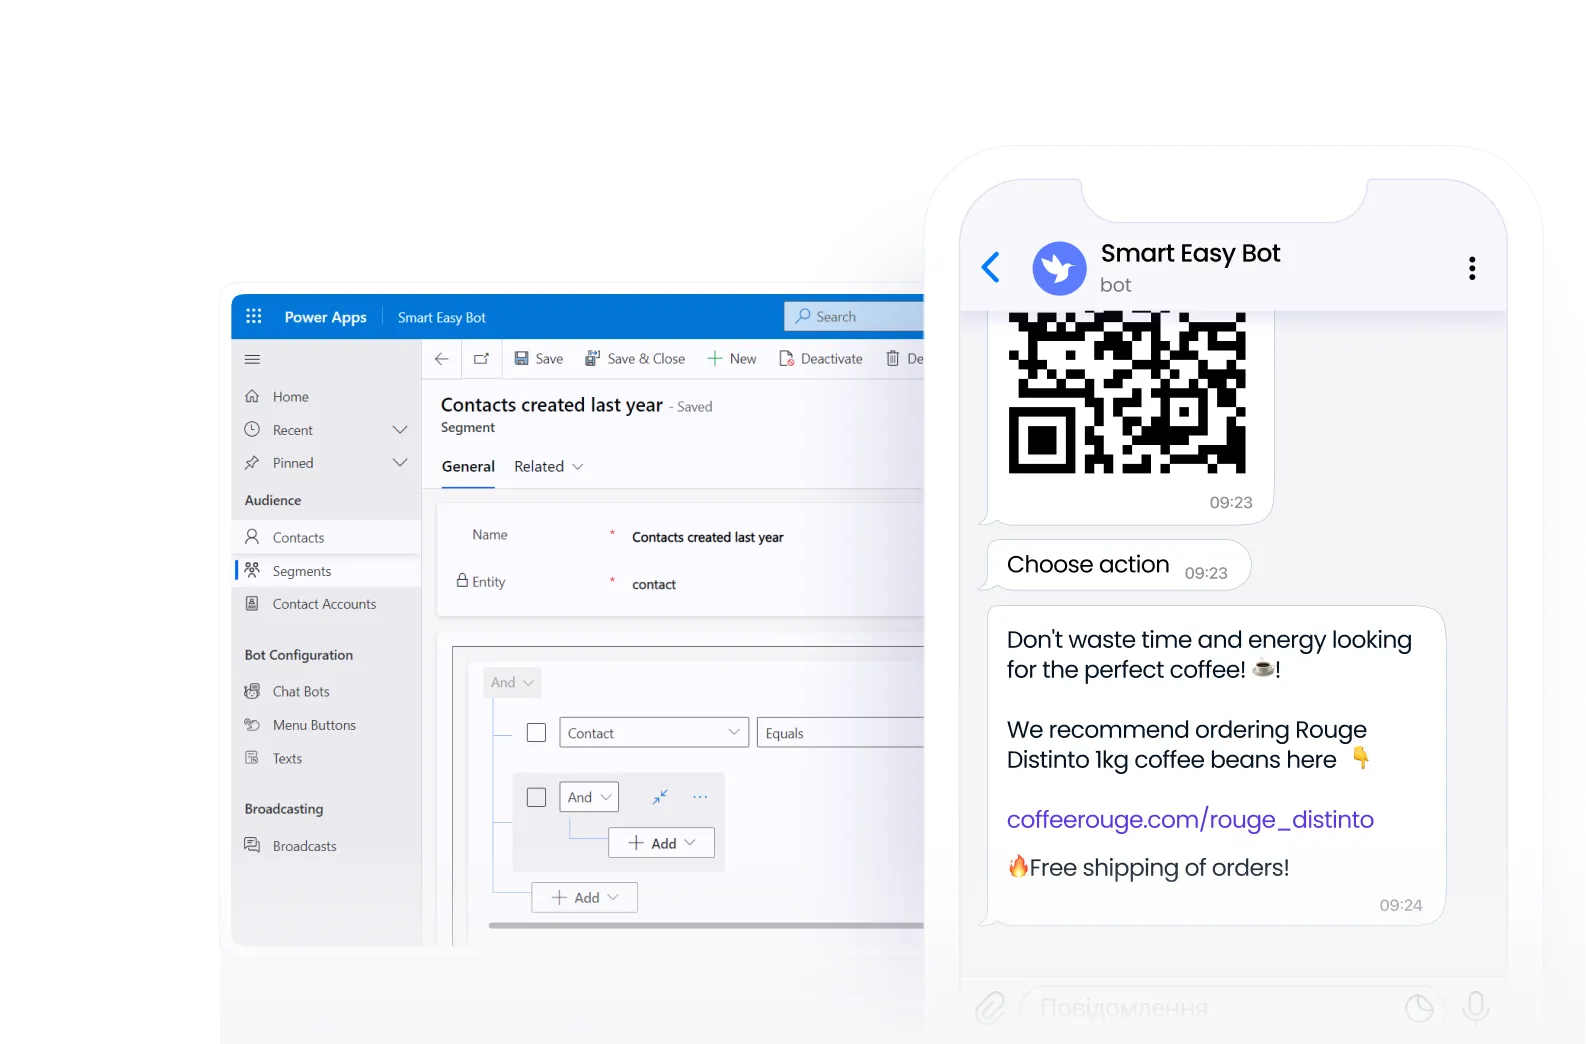
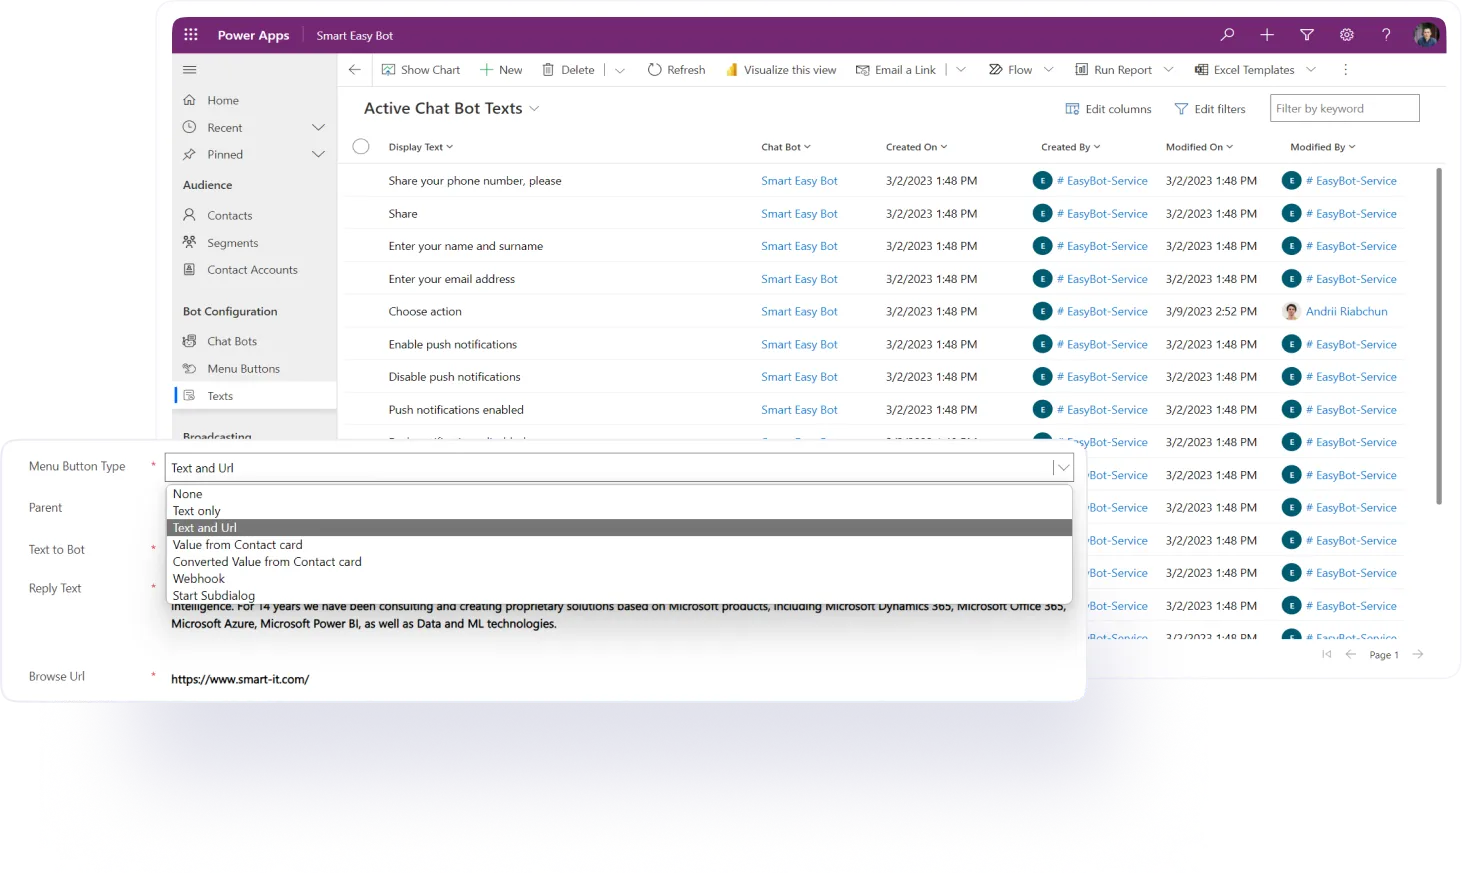
Add custom buttons with options: text only, text + link, CRM data output, or CRM data converted into barcodes or QR codes.
New button types support webhooks with responses and in-chat request creation.
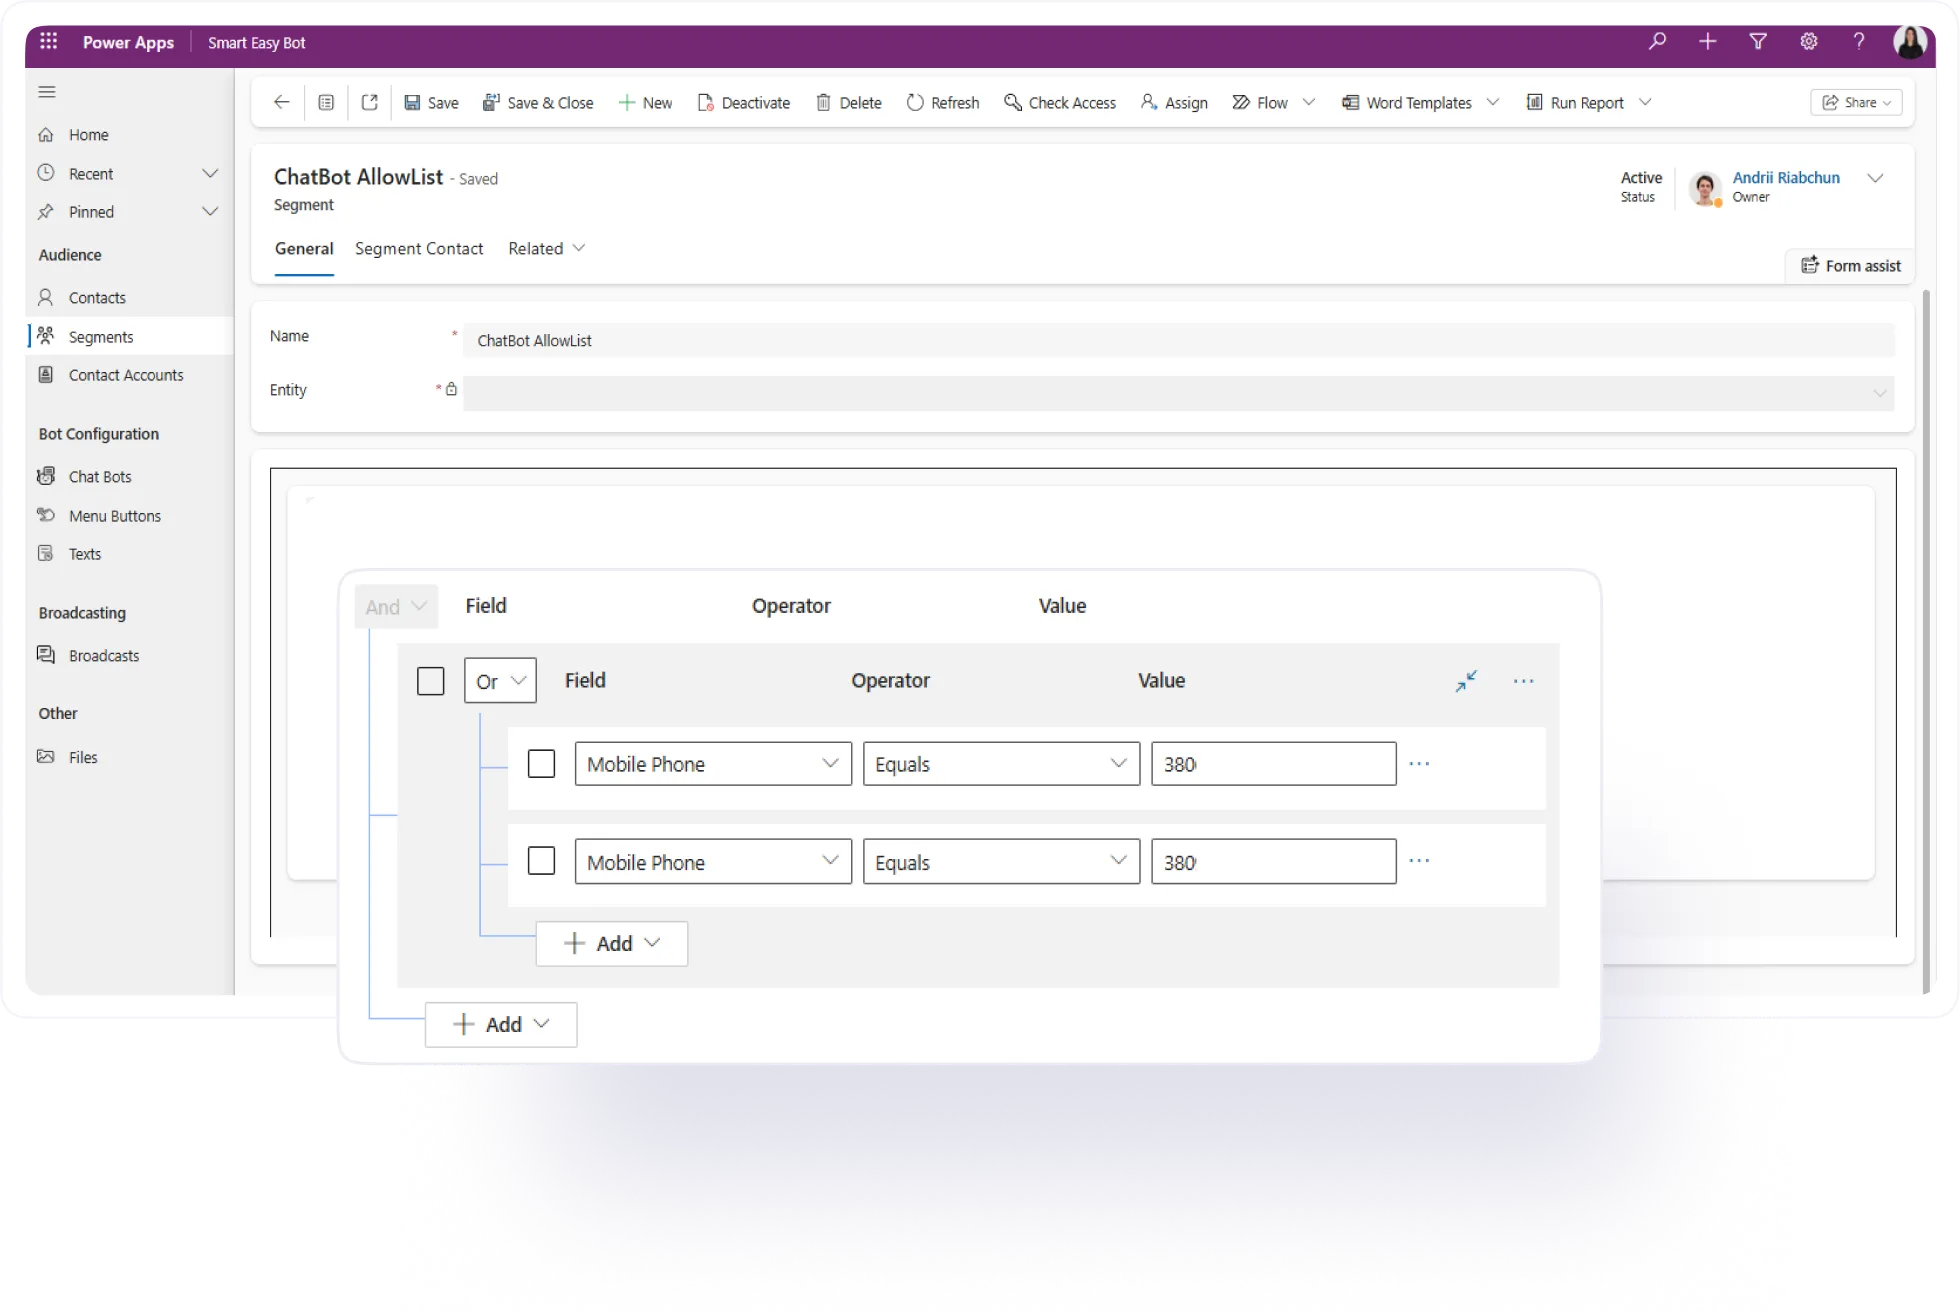
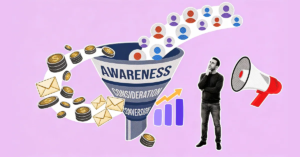
Build user segments directly in the solution. Communicate more precisely and personalize your chatbot interactions.
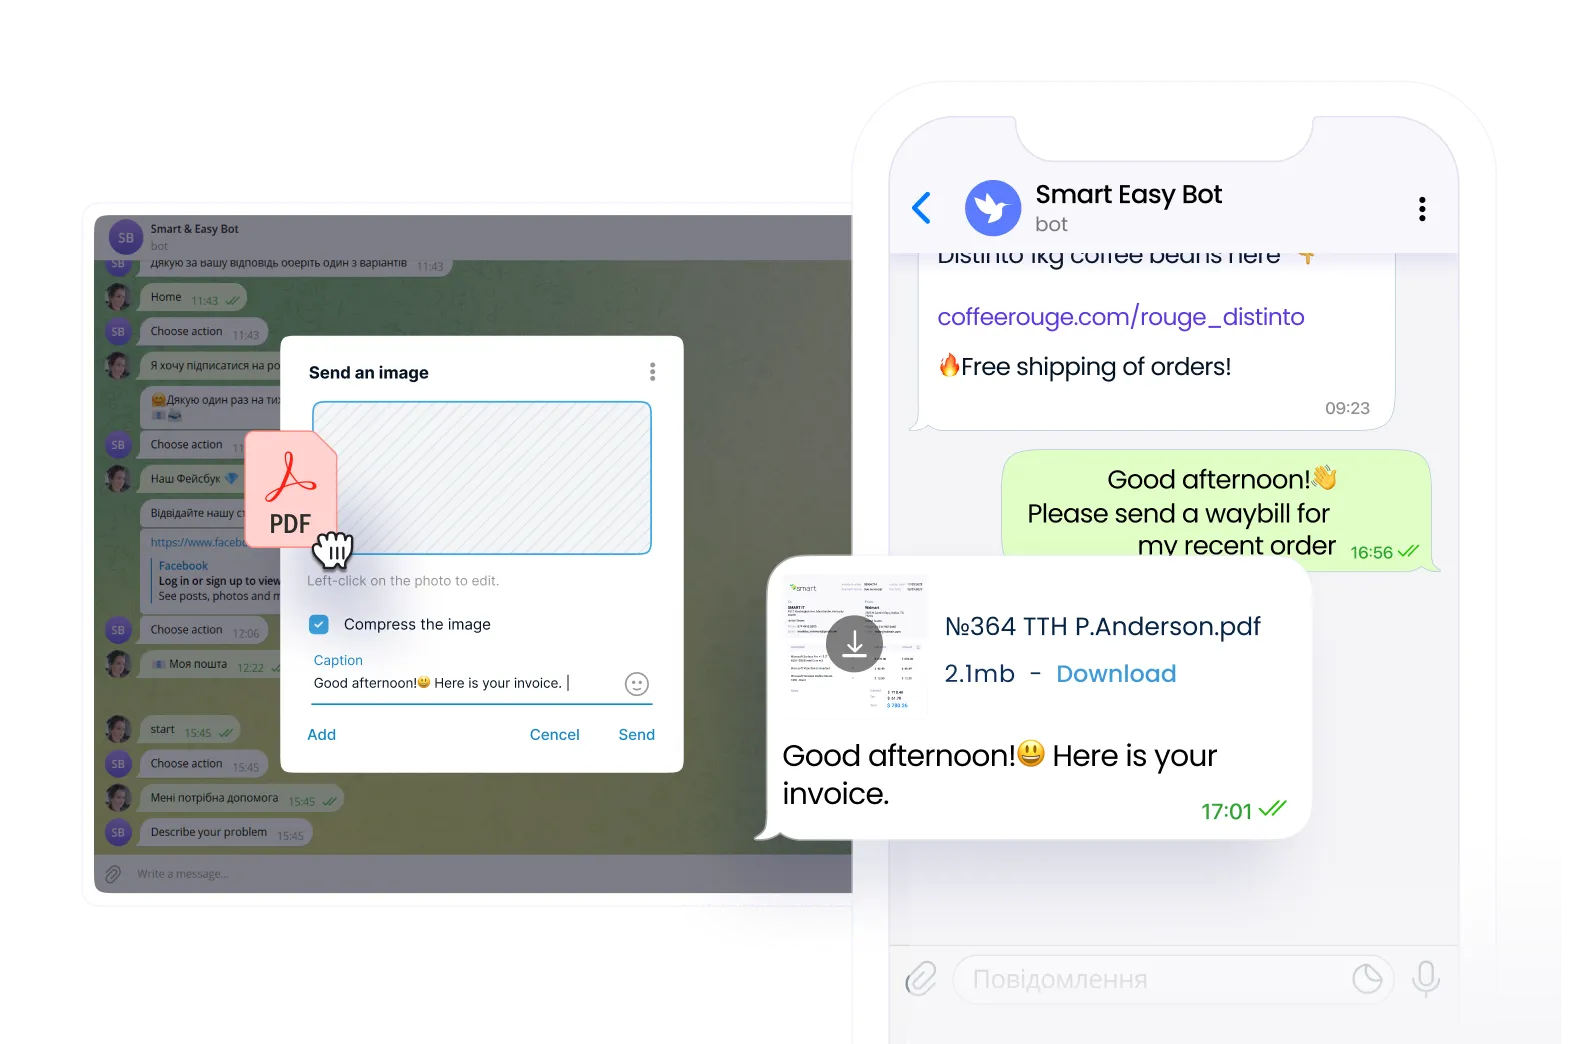
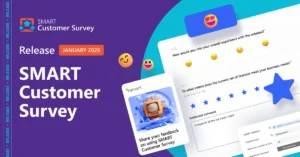
Use chatbots as a channel for communication and feedback collection in the form of requests and files.
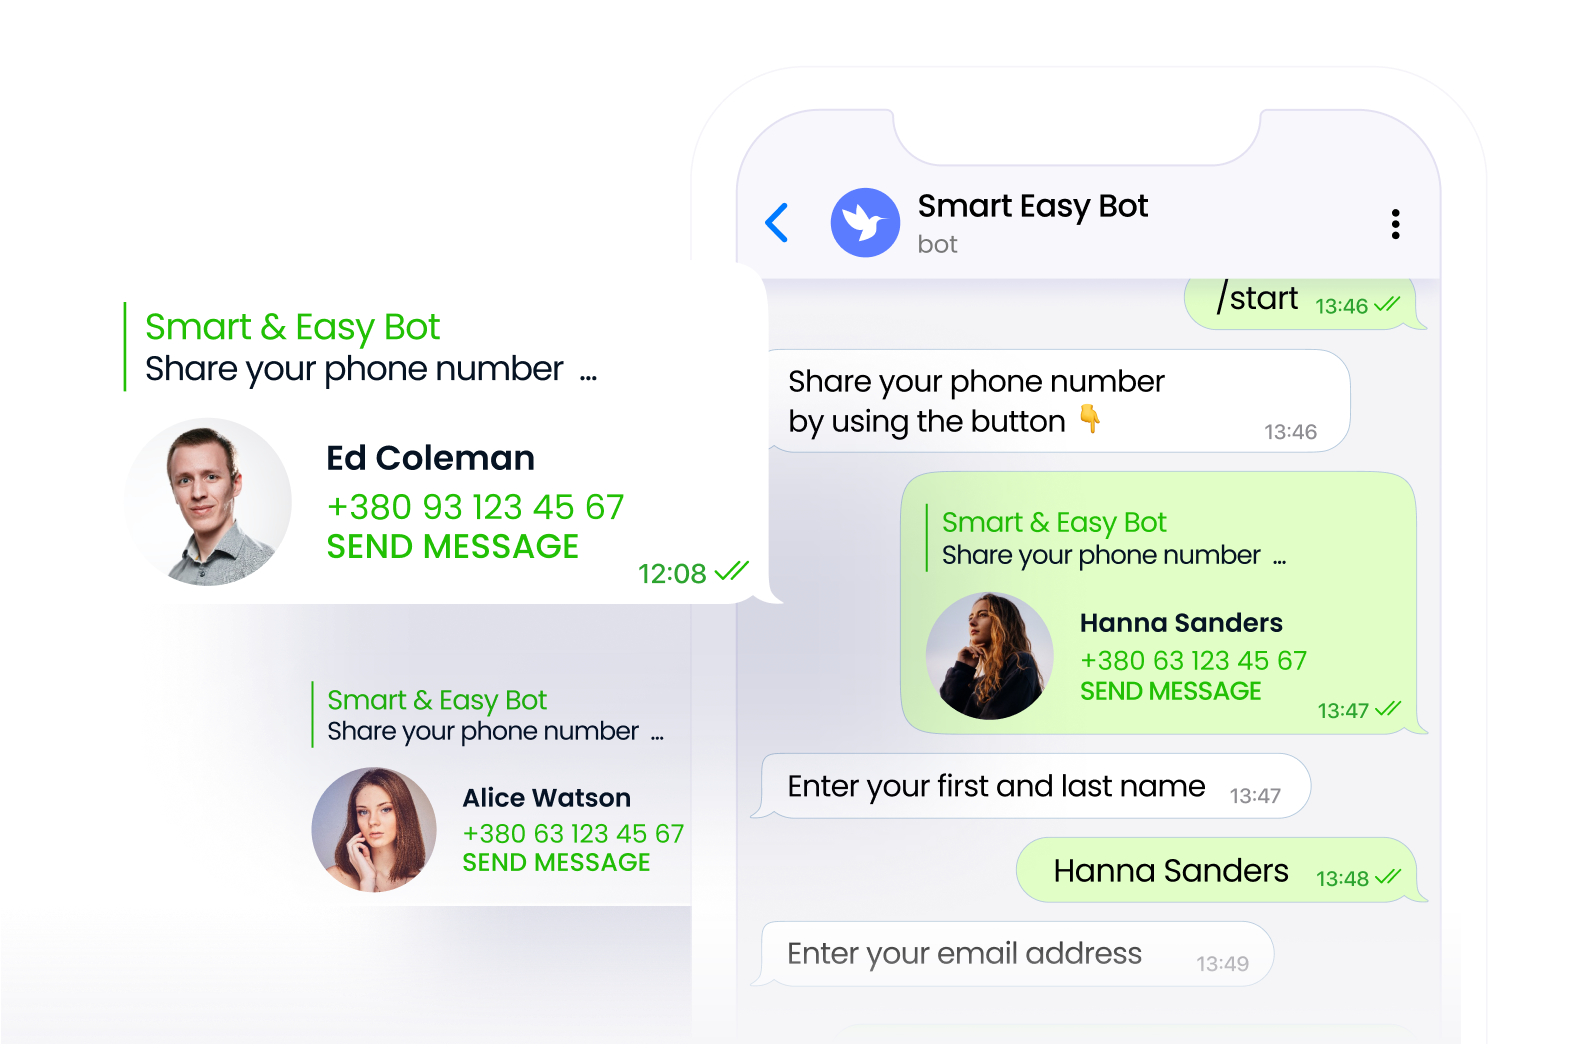
Populate your database with up-to-date, verified user information through registration during the first bot interaction.
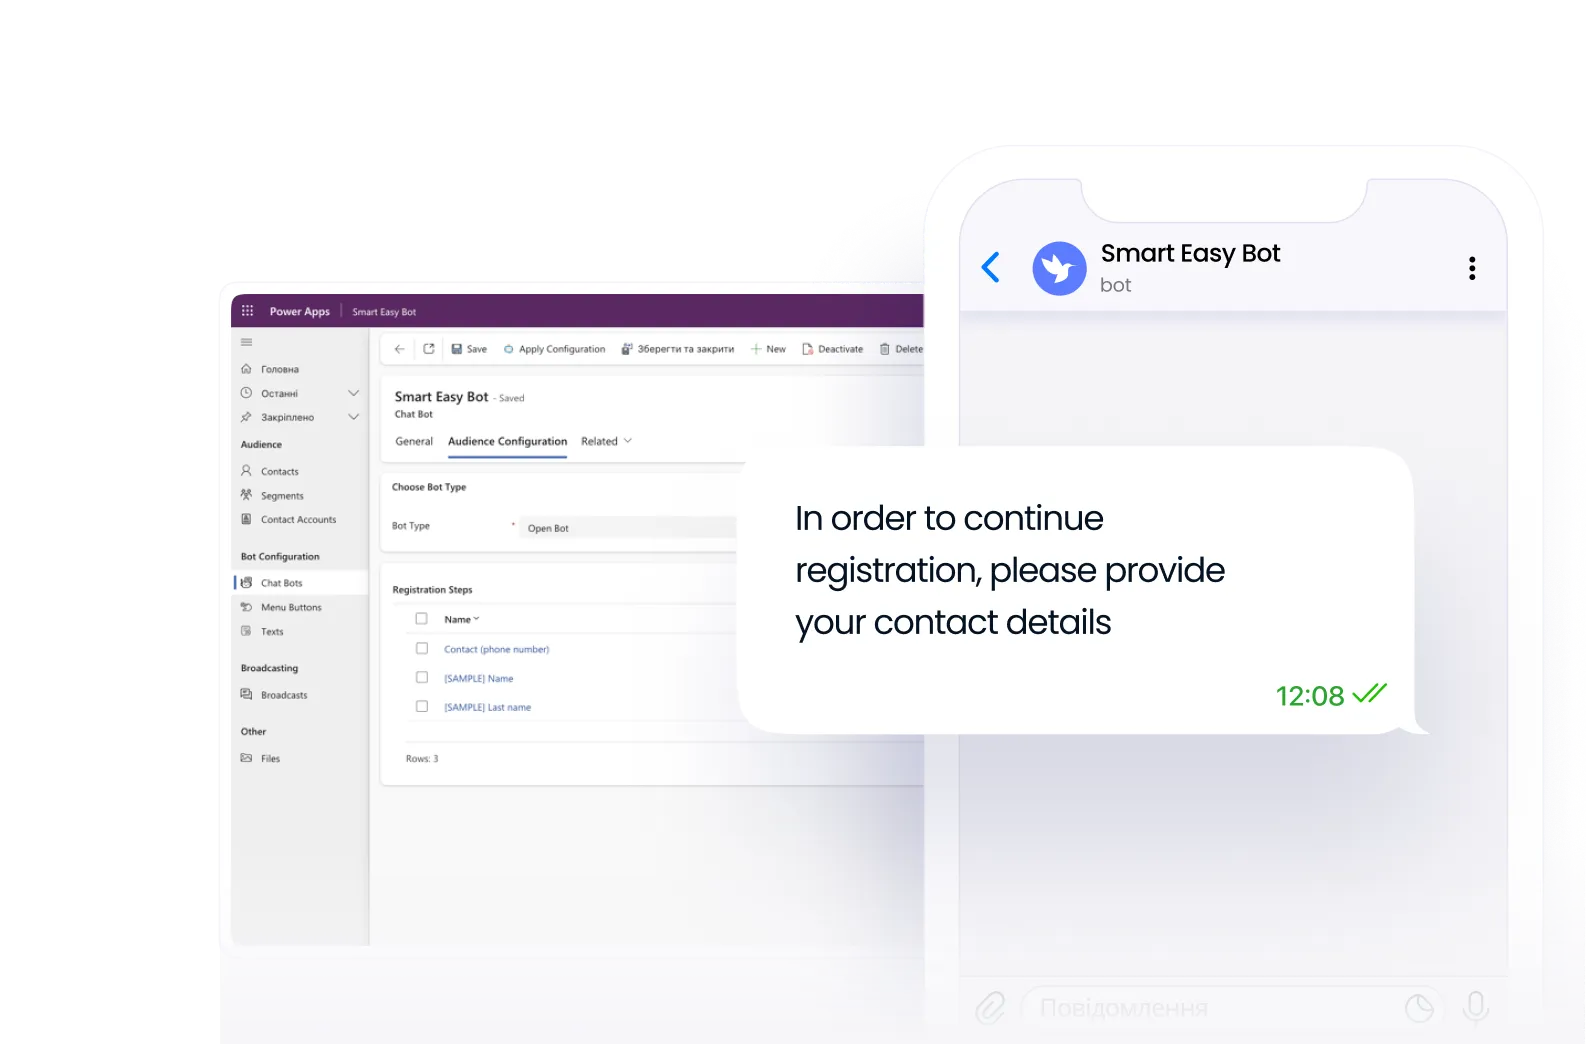
Control registration processes in CRM settings: add validation via regular expressions, manage button availability for registered users, and define login methods — registration, authorization, or combined mode. Disable registration if needed.
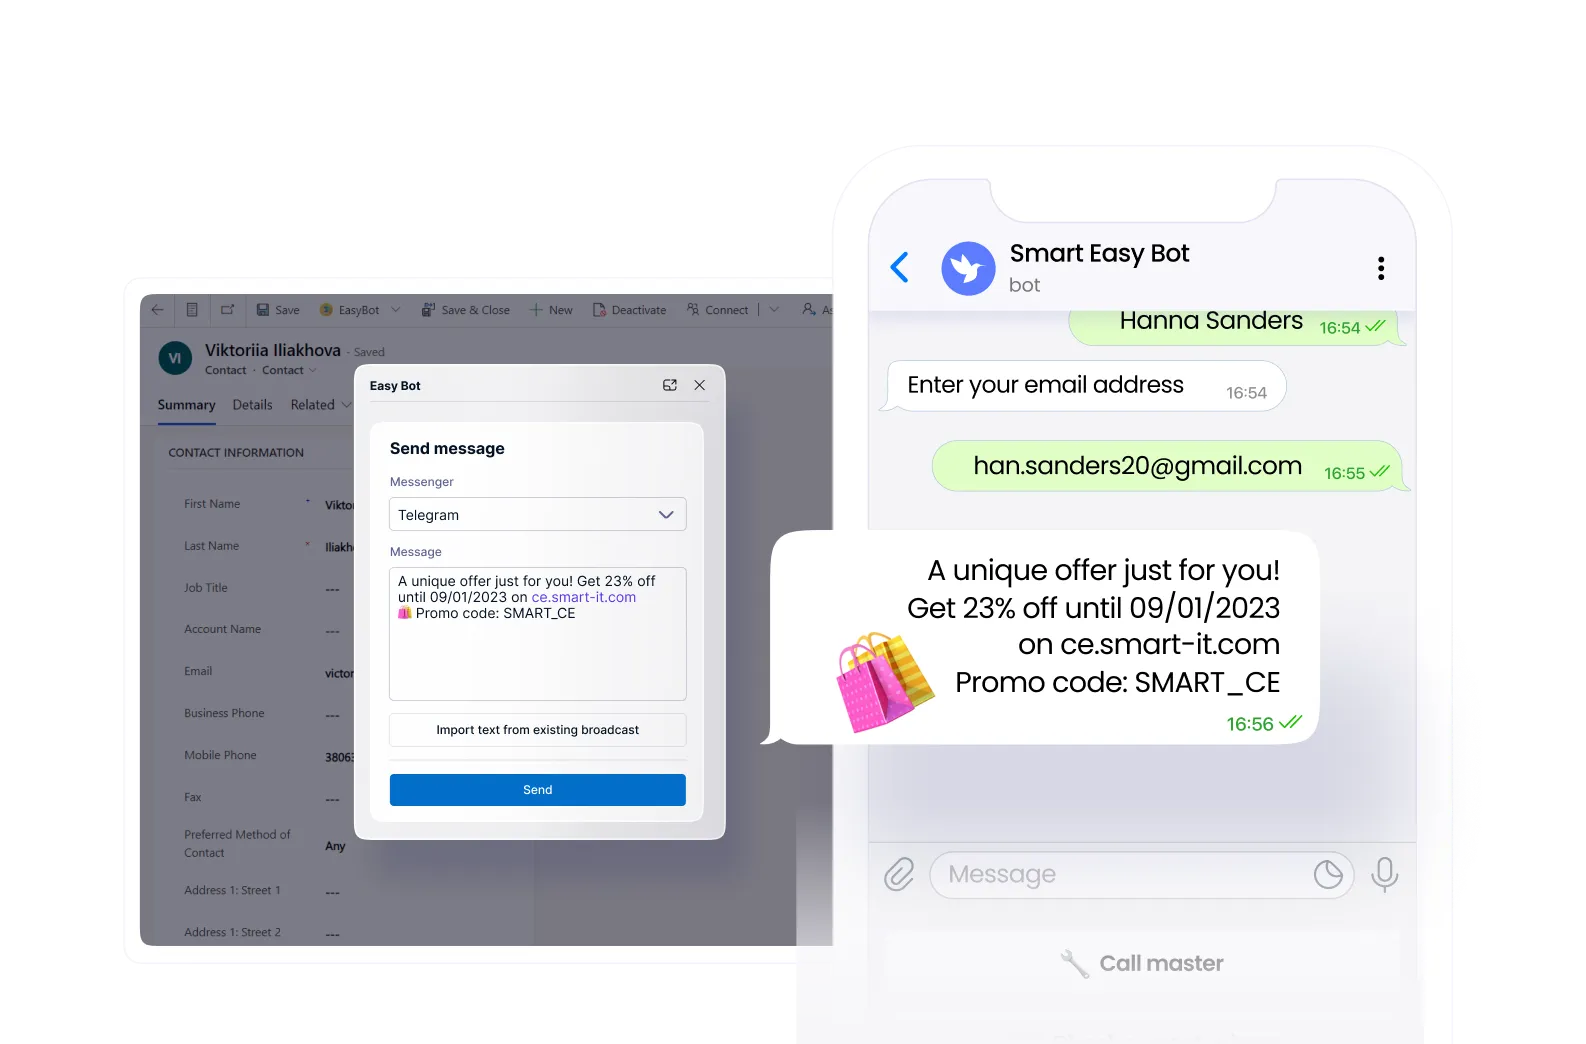
Generate individual texts for specific users directly from your CRM system. Convert texts into barcodes or QR codes.
Deliver personalized content—send files to individual clients or entire segments: documents, instructions, presentations, and other materials in a convenient format.
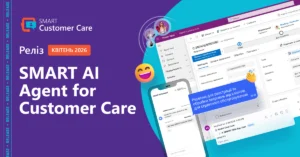
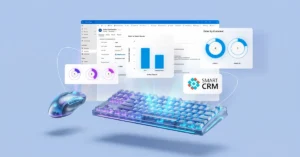
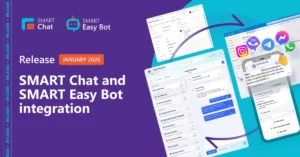
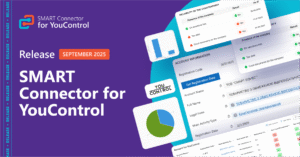
Administer chatbots from a single, intuitive interface directly within your CRM system.


* +Azure based on consumption.