Order a demo
INTEGRATIONS

Connect the necessary applications,

messengers and services so as not to miss a single customer request
integration
Advantages

All the necessary tools in one system

connectors advantages 1

Clear documentation on CRM integration

connectors advantages 2

Easy initial setup

connectors advantages 3

Fast connector deployment

connectors advantages 4

Support and expansion of connector functionality

Functional capabilities

Features of the connector

PRICING

Select your plan

SMART Connector for
Telephony (Binotel)*
$ 150 .00
for the use of the environment per month
API connector for Binotel IP telephony that provides the ability to receive incoming calls and make outgoing calls from SMART CRM
SMART Connector for
Telephony (Ringostat)*
$ 150 .00
for the use of the environment per month
API connector for Ringostat IP telephony that provides the ability to receive incoming calls and make outgoing calls from SMART CRM
SMART Connector for
Telephony (Stream Telecom)*
$ 150 .00
for the use of the environment per month
Connector to the API of the Stream Telecom IP telephony provider that enables receiving incoming calls and making outgoing calls directly from SMART CRM.
SMART Connector for
eSputnik*
$ 100 .00
for the use of the environment per month
API connector for eSputnik that provides the ability to configure and send email newsletters
SMART Connector for
GMS*
$ 100 .00
for the use of the environment per month
API connector for GMS Ukraine to set up and send newsletters via SMS/Viber
SMART Connector for
Infobip*
$ 100 .00
for the use of the environment per month
API connector for Infobip to set up and send newsletters via SMS/Viber
SMART Connector for
PayPal*
$ 100 .00
for the use of the environment per month
API connector for PayPal to create an invoice and provide the client with the ability to pay for it when ordering
SMART Connector for
UAPAY*
$ 100 .00
for the use of the environment per month
Connector to the UAPAY service API that enables the creation of a payment invoice for the customer directly during order processing.
SMART Connector for
Monopay*
$ 100 .00
for the use of the environment per month
Connector to the monobank service API that enables the creation of a payment invoice for the customer directly during order processing.
SMART Connector for
Przelewy24*
$ 100 .00
for the use of the environment per month
Connector to the API of the Polish Przelewy24 service for creating and allowing customers to pay invoices directly at the time of order.
SMART Connector for
Rozetka
$ 150 .00
for the use of the environment per month
A connector that enables processing of orders from the Rozetka marketplace directly in the SMART CRM or Microsoft Dynamics 365 interface.
SMART Connector for
Nova Poshta
$ 150 .00
for the use of the environment per month
API connector for Nova Poshta to create a waybill and send it directly when processing an order in CRM
SMART Connector for
Ukrposhta
$ 150 .00
for the use of the environment per month
API connector for Ukrposhta to create a waybill and send it directly when processing an order in CRM
SMART Connector for
Forms
$ 200 .00
for the use of the environment per month
A connector for configuring feedback and web forms directly in SMART CRM or any Power Platform–based solution. All information submitted through the form is instantly synchronized with the CRM
SMART Connector for
InPost
$ 150 .00
for the use of the environment per month
A connector to the Polish delivery service InPost, enabling the creation of shipping waybills for customer orders directly during processing in the CRM

*The price is indicated per connector. Use of Microsoft Azure resources is required for the operation of connectors and modules.

Blog

Articles and materials

8 min read
Visualization of dashboards in SMART CRM solutions
CRM Reporting in Action: Real Dashboard Examples in SMART CRM Solutions
CRM reporting starts working when a business can clearly answer simple questions: What’s happening with sales? Where are leads being lost? How is the team performing? And what truly impacts profit? To make these answers understandable and quickly digestible, the data needs not only to be collected but also visualized — charts, tables, and KPIs make the information more tangible and help managers make decisions without unnecessary interpretation. Calls, meetings, emails, deals, or service requests alone don’t solve anything — value appears when this data is recorded consistently and transformed into clear visual reports and KPIs within the CRM. Today, this is not a matter of convenience, but of business scalability. As the customer base grows, team workloads increase, and the number of touchpoints with each client rises. We covered in a separate article how a CRM reporting system is built, which KPIs genuinely influence management, and how to structure analytics correctly. In this article, we focus on the practical side — how dashboards help turn these metrics into a tool for daily management.

KPIs as the Foundation for Transparent CRM Reporting

Charts and tables on dashboards are built around specific metrics: conversion rates, average check size, manager activities, or response times. This allows managers to immediately see metric trends and deviations from the plan, while the team understands which processes require focus. In this format, KPIs become a guide for daily work and systematic performance monitoring. The SMART CRM platform by SMART business offers ready-made analytical tools for data-driven sales and service management. Built-in dashboards and Power BI integration allow managers, team leads, and operators to see the status of deals, inquiries, and SLA compliance in real time. Submit a request

Sales Analytics in SMART Sales: A Complete Real-Time View of Deals

The Power BI analytics panel integrated into SMART Sales displays key sales metrics without the need to manually gather data or consolidate reports in spreadsheets. Managers or team leads can immediately see such key metrics as:
  • Open Total Amount — the total value of deals currently in the pipeline
  • Open Count — the actual workload on the team
  • Win Count and Win Rate — the actual sales performance
Filters allow instant adjustments to the data view:
  • Analyze sales by deal types (active, new, lost)
  • Compare results by countries and regions
  • Evaluate the performance of specific managers
  • See which lead sources actually generate deals, not just traffic
Visualizations complement the picture:
  • A histogram of deals by funnel stage shows where they get “stuck”
  • A deal map allows assessment of sales geography
  • A comparison chart of deal amounts and counts by manager helps identify differences between activity and results
The essence of this dashboard is to give managers and teams a clear understanding of sales performance, enabling:
  • Managers to see deal status in real time
  • Leaders to analyze team efficiency and lead sources
  • The company to have a single source of truth for decision-making

Service Operator Workspace Dashboard Without “Blind Spots”

The operator dashboard in SMART Customer Care combines analytics and the daily work plan in a single window, transparently showing:
  • A list of active customer inquiries — who contacted, with what issue, and at what stage the case is
  • Which channels generate the most requests (chat, email, phone, website)
  • Distribution of inquiries by priority — what requires immediate attention
  • Types and topics of inquiries — product issues, questions, requests for modifications, etc.
Separate activity blocks show:
  • How many tasks are currently in progress
  • Whether there are communications stuck without response or action (emails, calls, meetings)
  • Where workload is accumulating
The value of this dashboard is that the company does not operate “blindly.” It can quickly assess the situation, set priorities correctly, and maintain consistent quality in customer interactions even with a high volume of inquiries.

SLA Monitoring Dashboard for the Service Manager: Data as the Basis for Management Decisions

The service manager’s workspace in SMART Customer Care focuses on monitoring SLA compliance and the quality of team performance. The dashboard displays:
  • A line chart showing the trend in the number of new inquiries over a selected period, allowing peak workload periods to be tracked
  • A bar chart showing the distribution of cases by responsible teams and statuses
  • A chart showing the number of overdue first responses, broken down by channel
  • A pie chart indicating where final resolution of inquiries is most frequently delayed and in which categories
Detailed tables allow managers to quickly move from high-level analytics to specific cases and understand the root cause of an issue rather than simply recording the fact of a violation. The essence of this dashboard is to transform SLA monitoring from a formal check into a live service management tool: identifying systemic failures, adjusting processes, and improving customer satisfaction based on data.

Binotel Manager Dashboard — Call Analytics in SMART CRM: Real-Time Communication Control

The Binotel Manager Dashboard is part of the SMART Connectors analytics, which integrates telephony directly with the CRM. In essence, it is a single workspace for analyzing calls and the quality of how they are handled by the team. The dashboard consolidates all key data related to phone interactions with customers. The manager sees a list of calls with details: when the contact took place, whether it was successful or canceled, and which team member was responsible for handling it. This eliminates the typical question, “Who called the client, and what happened next?” A separate chart shows the number of calls by day, allowing managers to quickly assess team workload, identify peak days, and correlate them with sales or service results. An important management block covers missed calls and related activities. The dashboard immediately highlights unprocessed calls, open tasks, scheduled contacts, or drafted but unsent messages. This helps prevent customer loss due to minor lapses in discipline. For managers, call analytics by employee is particularly valuable. It shows who is actively working with customers and where workload distribution may be uneven. Additionally, the dashboard displays call priority levels, helping the team focus on the most critical or valuable contacts. Overall, SMART Connectors transform raw telecom system data into clear CRM analytics, enabling managers and sales or service teams to:
  • Monitor the quality of customer communications
  • Reduce the number of missed contacts
  • Increase operator productivity
  • Optimize sales and support processes

SMART Marketing: Marketing Campaign Analytics

This dashboard within SMART Marketing provides a comprehensive view of marketing activity in Power Apps — from campaign statuses to channels, sources, and communication quality. What it shows:
  • Campaign list with statuses — it is immediately clear which campaigns are completed, which are in progress, and which have been stopped. This helps quickly assess the state of the marketing portfolio without manual checks.
  • Campaign sources — shows which systems or platforms campaigns were initiated from, simplifying control over integrations and launch points.
  • Communication channels — email, SMS, Viber/SMS, allowing teams to see which channels are used most frequently and how activity is distributed among them.
  • Consolidated activity metrics — the number of marketing activities, tasks, email drafts, and meetings, providing an understanding of the team’s actual operational workload.
Thus, the SMART Marketing dashboard transforms fragmented campaign data into clear analytics that helps the marketing team work in a more predictable, structured, and results-oriented way.

How CRM Analytics Helps in Making Management Decisions

When all sales, service, marketing, and communication metrics are consolidated within a single CRM system, managers no longer rely on subjective reports or fragmented information from teams. Instead, they see a complete picture of processes in real time. CRM analytics in SMART CRM enables companies to:
  • Quickly identify bottlenecks in the sales funnel and adjust stages where leads are being lost
  • Assess the actual workload of service teams and redistribute resources accordingly
  • Monitor SLA compliance and respond to deviations before they affect customer satisfaction
  • Analyze the effectiveness of marketing channels and focus the budget on those that deliver results
  • See the relationship between team activities and financial performance indicators
Thus, analytical dashboards become the foundation of daily management: they help plan, forecast, and timely adjust business processes.

Conclusion:

SMART CRM helps transform sales, service, and marketing data into clear management analytics. If you want to see the real picture of your business rather than manually compiling reports, start by reviewing your own processes. Request a consultation of SMART business experts to transform your operations into measurable metrics and improve your team’s performance. Request a consultation
26 min read
visualization of business operations with analytical reporting
CRM Reporting: From Sales to Service — KPIs, Management Best Practices, Reports, and Business Analytics
According to Fortune Business Insights, a leading international market research and consulting company, the global CRM market continues to demonstrate steady growth. While it is projected to reach USD 126.17 billion in 2026, it may grow to USD 320.99 billion by 2034. This dynamic reflects a clear and systemic trend: companies worldwide are investing in customer relationship management technologies not only to automate sales processes, but also to enhance marketing effectiveness, service performance, and management analytics. That is why CRM reports, KPIs, and analytical dashboards are not about micromanagement. They are about establishing unified standards of work, creating shared visibility into results, and enabling CRM systems to help businesses assess performance, optimize processes, and make data-driven decisions — rather than relying on intuition or assumptions. Would you like to explore the reporting capabilities of modern CRM systems right now? Submit a request and discover the reporting dashboards available on the SMART CRM platform. Submit a request

What Is CRM Reporting and How Is It Structured?

CRM reporting is a way to structure daily work with customers and turn it into a system of measurable results. It consolidates data from sales, service, and customer interactions into a unified model where each metric has a clear business purpose. Leads, pipeline stages, manager activities, conversion rates, average deal size, and service requests become the foundation for analytics and performance evaluation within this approach. In practice, CRM reporting is built across several levels and covers key business areas:
  • Sales pipeline — lead structure, stage-to-stage conversion rates, performance forecasting, and process stability.
  • Manager effectiveness — activities, productivity, KPI achievement, and overall sales department performance.
  • Customer interaction — quality of request handling, consistency of service processes, and adherence to established service standards, directly influencing customer satisfaction metrics.
  • Financial indicators — average deal size, customer acquisition cost, and the impact of operational processes on profitability.
A systematic approach to these reporting levels makes it possible to evaluate the effectiveness of investments in sales, marketing, and service. Analytical reports help identify trends, track performance dynamics, compare teams, and assess the effectiveness of marketing campaigns based on specific results. Request a consultation

Key Types of CRM Reports for Effective Business Process Monitoring

There is a core set of reports without which it is impossible to gain a complete picture of sales performance and team effectiveness. Managed CRM reporting starts with these foundational reports. Additional reports can be configured for specific processes, roles, or business metrics — but they only deliver value once the core analytics framework is stable and consistently used.

Sales Pipeline Report

This report provides a full overview of all active deals — including their number, total value, stages, and assigned owners. The pipeline helps identify bottlenecks — points where deals stall or conversion rates decline. Sales managers and executives use it to:
  • prioritize deals within the team’s workload,
  • conduct weekly sales progress reviews,
  • forecast results for upcoming periods.
Example of how a report is used in CRM: A company sees in its CRM system that out of 500 leads:
  1. 320 move from the “Qualification” stage to “Commercial Proposal”
  2. only 90 reach the “Negotiation” stage
  3. 35 deals are successfully closed
Pipeline analytics reveal a sharp drop in conversion specifically between the “Commercial Proposal” and “Negotiation” stages. Additional CRM analysis shows that:
  • managers send proposals with a 2–3 day delay
  • in some deals, no follow-up calls are logged after the proposal is sent
Based on these insights, the company takes the following actions:
  1. Introduces a Mandatory, Automated Follow-Up Standard After Sending a Proposal
A rule is configured in the CRM: once a commercial proposal is marked as sent, the system automatically triggers a control timer. The time of sending becomes the trigger for workflow automation:
  • the CRM automatically creates a task for the manager to call the client within 24 hours,
  • sets a deadline and reminder without manager involvement,
  • prevents stage changes if no activity has been logged,
  • records compliance or violations of the standard in activity reports.
If no call is logged within the defined timeframe, the CRM flags the deal as at risk or marks it as a process deviation. As a result, proposals no longer “sit” without feedback, and follow-ups become a structured, transparent part of the pipeline. In activity reports, managers can see not only whether contact was made, but also whether it was timely. This makes it possible to directly link follow-up discipline to conversion at the proposal stage and overall sales performance.
  1. Revises Commercial Proposal Templates
CRM analytics show that deals with similar characteristics (customer segment, product type, deal size) produce different outcomes after proposals are sent. This signals the need to revise the proposal templates themselves:
  • overly generic or overly technical sections are shortened
  • clear next steps for the customer are added (what to do after receiving the proposal)
  • wording is adapted for different customer segments
The updated templates are uploaded into the CRM, allowing the company to track how changes in proposal structure impact conversion rates and deal closing speed. As a result, conversion between stages improves, and sales forecasting becomes more accurate.

Sales Forecast Report in CRM: Expected Revenue and Plan Achievement

A sales forecast report in CRM shows expected revenue based on the current deals in the pipeline — taking into account their stages, probability of closing, and planned close dates. In essence, the system answers a key management question: how much revenue the business can realistically expect to generate in the upcoming period based on the current pipeline. How Forecasting Is Built in CRM in Practice For each deal, the system can factor in:
  • deal value
  • pipeline stage
  • closing probability assigned to that stage
  • expected close date
For example, if the pipeline includes:
  • 10 deals worth 100,000 each at the “Commercial Proposal” stage with a 40% closing probability
  • 5 deals worth 200,000 each at the “Negotiation” stage with a 70% probability
the CRM calculates the forecast as follows:
  • 10 × 100,000 × 0.4 = 400,000
  • 5 × 200,000 × 0.7 = 700,000
In the report, the manager sees a projected revenue of 1.1 million for the selected period, broken down by stages, sales reps, or business units. What Management Decisions Does This Report Enable? With regular forecast reviews, companies often identify typical issues:
  • deals without an expected close date are automatically excluded from the forecast, understating projected revenue
  • “stalled” deals remain in the pipeline for months, artificially inflating the sales plan
Based on this CRM reporting, the company can:
  • introduce a mandatory “expected close date” field for all deals
  • configure automatic rules to flag inactive deals (for example, no logged activities for more than 14 days)
  • adjust the sales plan and resource allocation, focusing on deals with a high probability of closing within the current period

Top Deals Report in CRM: Focusing on the Opportunities That Drive the Greatest Profit

The Top Deals report in CRM shifts the focus from the number of activities to the deals that have the greatest impact on business profitability. Typically, this includes 10–20% of opportunities that generate the majority of projected revenue and directly influence sales plan achievement. How the Report Works in Practice In CRM, filters are configured based on key criteria such as:
  • deal value (for example, deals starting from 300,000)
  • lead source
  • customer segment (enterprise, mid-market, SMB)
  • responsible manager or team
As a result, a manager may see, for example, 15 active deals that account for 60–70% of the expected quarterly revenue. Example of Management Use Analytics may reveal that:
  • five of the largest deals came from a single channel (partner referrals)
  • some top deals have remained at the “Negotiation” stage longer than average
  • several high-value deals show minimal activity from the assigned manager
Based on these insights, the company can:
  1. shift the Sales Director’s focus from overseeing the entire pipeline to supporting top-priority deals
  2. involve presales specialists or senior management in strategic negotiations
  3. reallocate marketing investments by strengthening the channels that generate the highest-value clients
  4. proactively identify risks of key contract failure based on specific operational signals (for example, prolonged stagnation at a single pipeline stage, absence or sharp decline in activities, misalignment between deal status and actual actions, changes in the forecasted close date, etc.). This approach makes it possible to respond before these factors impact financial results

Manager Activity Report: Linking Actions to Outcomes

The activity report in CRM shows not only the number of calls, emails, and meetings, but also how managers’ actions influence deal progression through the pipeline. For the report to work effectively, the company may first define a minimum activity logging standard in CRM. For example:
  • for new leads — first contact within 24 hours
  • for active deals — at least one logged activity per week
  • for key stages — a mandatory call or meeting, not just email communication
The CRM then enables the company to correlate activities with actual sales performance. For example, the report may show that:
  • deals with 2–3 contact points before reaching the negotiation stage have significantly higher conversion rates
  • a high volume of emails without calls correlates with a longer sales cycle
  • managers with fewer but consistently logged activities close deals faster
Based on this analysis, the company can:
  1. refine customer engagement standards (defining which activity types are mandatory at different stages)
  2. identify situations where activity exists but does not generate results
  3. address trends at the team level rather than focusing solely on individual managers

Sales Funnel Conversion Report: From Lead to Signed Contract

The conversion report shows how leads move through the key stages of the funnel — from the first contact to a successful deal. It allows you not to guess why sales are dropping, but to see the specific stage where the process breaks down. Uses of the report:
  1. Identifying conversion drops due to lead quality — the CRM compares the number of incoming leads with the number of leads that advance to “Opportunity” status.
Example: Out of 300 leads, only 25 become opportunities. This signals that marketing is bringing in traffic that doesn’t match the target customer profile, or that lead sources need to be reviewed.
  1. Diagnosing qualification issues — the report shows at which stage leads most often “stall” or get rejected.
Example: Leads remain in the initial qualification stage for a long time, and managers move them to “Rejected” for various reasons. This indicates the team lacks unified qualification criteria or consistent lead-handling scenarios.
  1. Monitoring CRM data quality — the system tracks deals with missing or incorrectly filled fields, which affect analytics.
Example: A deal moves to “Won” status, but the amount or lead source is not filled in. As a result, the conversion report looks positive, but financial and marketing decisions are based on inaccurate data. The conversion report allows you to:
  • Make decisions based on facts, not intuition
  • Share responsibility between marketing and sales
  • Scale the funnel without losing control

Lead Source Report in CRM: Performance of Each Marketing Channel

The lead source report allows you to compare acquisition channels not by the number of inquiries, but by their business value: quality, conversion rate, and actual contribution to revenue. It shows which channels should be scaled and which should be reviewed or turned off. Key Report Capabilities
  1. Data standardization in the CRM — the report works properly only when data is unified: a consistent source/medium logic is used, along with UTM parameters and standardized channel directories. For example, if some leads have the source listed as “Website,” others as “Site,” and some have the field left blank, the CRM cannot accurately calculate channel performance. Standardization provides a single, reliable view and prevents reporting distortions.
  2. Evaluating lead quality, not just volume — CRM reporting allows you to compare sources based on how they move through the funnel: leads → opportunities → deals → revenue.
Example:
  • Facebook Ads generates 120 leads, but only 5 convert into opportunities.
  • Webinars generate just 20 leads, but 8 of them turn into deals.
The report clearly shows that a lower-volume channel can be significantly more profitable for the business.
  1. Marketing investment optimization — based on conversion rates and actual revenue, the CRM helps inform decisions about budget reallocation.
Example: The report shows that SEO leads have a longer sales cycle but a higher average deal value, while paid advertising generates faster but smaller deals. This makes it possible to balance the budget between short-term and long-term growth channels. The Lead Source Report helps you:
  • Invest your marketing budget strategically
  • Align marketing and sales based on shared data
  • Scale effective channels without compromising lead quality

Service Report in CRM: Monitoring SLA Compliance, Response Speed, and Support Quality

When a CRM system is used not only for sales but also for customer service, these reports become a key tool for quality control. They allow you to evaluate service performance using concrete metrics rather than subjective impressions. What the Report Can Show:
  1. First Response Time — the CRM records the moment a request is created and the first reply from a manager or support team.
Example: The report shows that the average first response time is 6 hours, while the SLA requires no more than 2 hours. Additional CRM analysis reveals that delays occur outside business hours or when specific team members are overloaded. Based on this insight, the company adjusts shift schedules or configures automated responses.
  1. Resolution Time — the CRM system tracks the full lifecycle of a request, from registration to closure.
Example: CRM data shows that technical requests are resolved in an average of 1 day, while financial requests take 4 days. This signals a need to review processes between the service and finance teams or to introduce a separate request category with priority handling.
  1. Backlog and Request Categories — the report provides visibility not only into the number of open tickets, but also into their structure.
Example: Category analysis shows an increase in requests related to a specific product feature. This may indicate usability issues or insufficient documentation. CRM data then becomes the basis for updating user guides or improving the product.
  1. SLA Compliance — the CRM automatically compares actual performance against SLA terms and flags deviations.
Example: The report shows that 15% of requests from key customers breach SLA due to delayed first responses. The company introduces a priority queue for this segment and sets up automated alerts when there is a risk of SLA violation. The Service Report enables you to:
  • Monitor support quality in real time
  • Prevent SLA breaches before the customer experiences the impact
  • Increase customer satisfaction and retention through data-driven decisions

Goals and Plans Report: Monitoring Performance in Plan vs. Actual Mode

This report allows you to compare planned targets with actual sales results — both at the team level and for individual managers. It removes subjectivity from performance evaluation and shifts the discussion about goal achievement into the realm of data. What the report analyzes:
  1. Plan Actual Comparison — the CRM aggregates actual deal data (total closed sales, number of deals, average deal size) and compares it against the set targets.
Example: The report shows that the team achieved 92% of the plan, but 3 managers overperformed while others consistently lag behind. This helps leadership understand that the issue isn’t the overall plan, but uneven workload distribution or differences in individual efficiency.
  1. Breakdown by Role and Period — targets may differ for SDRs, sales managers, and department heads, and the report allows analysis by month or quarter.
Example: CRM data shows that SDRs consistently meet their lead generation targets, but conversion to deals is below expectations. This indicates the need to review lead qualification criteria or handoff processes to sales. Thus the Goals and Plans Report helps you:
  • Make KPI achievement transparent and measurable
  • Adjust plans proactively rather than “rescue the quarter” in the last week
  • Support management decisions with data rather than intuition

Tasks and Follow-Up Report in CRM: Are Deals Moving Forward?

This type of report shows how deals are progressing. It helps determine whether each lead or deal has a clear next step and whether the team is keeping commitments to customers. What the report shows:
  1. Planned and Overdue Tasks — the CRM tracks all tasks linked to leads and deals and displays their status.
Example: The report shows that 30% of active deals have overdue follow-ups. This signals that deals are effectively “stalled,” even if they appear active in the pipeline.
  1. Next Steps in Deals — for each deal, you can see whether a next action is planned (call, meeting, document delivery, etc.).
Example: Analysis shows that deals without a planned next step close on average 40% less successfully. Based on this, a CRM rule is introduced: a deal cannot remain without an active task.
  1. Overall Lead Progress — the report allows managers to quickly assess sales momentum without digging into each deal individually.
Example: A manager sees that the number of active deals is growing, but completed tasks are declining. This indicates a risk of accumulating deals without real progress and potential future conversion failure. The Tasks and Follow-up Report helps you:
  • Keep deals moving forward without manual oversight
  • Reduce the risk of losing customers due to “forgotten” follow-ups
  • Ensure predictable results through process discipline
Request a consultation

CRM KPIs: Which Metrics Truly Impact Company Performance

The effectiveness of a CRM system is not defined by the amount of data collected, but by how well that data supports informed decision-making. Key performance indicators (KPIs) should be limited in number (3–5 core metrics per role), measurable within the system, and directly tied to revenue or customer satisfaction. Only this approach enables process optimization and sustainable scalability.

Sales KPIs: Individual Performance Metrics

For sales professionals working “in the field,” core KPIs focus on operational discipline and the ability to convert interest into revenue. A CRM system automatically captures the following metrics:
  • Lead Response Time — the time between a lead entering the system and the first contact. This is a critical metric, as customers often buy from the company that responds first. The faster a manager reaches out, the higher the likelihood of conversion.
  • Activity Level — the actual number of calls, meetings, and presentations conducted per day or week. This reflects how proactively the salesperson is moving prospects toward a purchase rather than simply waiting for inbound inquiries.
  • Stage Conversion Rate — the percentage of customers moving from one status to another. This helps identify where a manager is losing audience interest. For example, if a sales representative moves 70% of leads from “Qualification” to “Proposal,” but only 30% advance to “Negotiation,” this signals the need for additional training or adjustments to follow-up scenarios.
  • Average Deal Size — reflects the specialist’s ability to communicate product value and offer additional solutions.
  • Win Rate — the ratio of successfully closed deals to the total number of opportunities handled by an individual specialist.
  • Sales Cycle Length — the time a specific specialist takes to move from first contact to deal closure.
KPI data helps identify where activity translates into results and where processes require optimization. A CRM system converts these metrics into clear reports and dashboards for daily monitoring.

KPIs for Sales Leaders

A Head of Sales focuses not on the details of individual calls, but on the overall health and momentum of the entire department. Their reports and analytics should highlight systemic risks and strategic performance indicators:
  1. Pipeline Coverage — whether the team has a sufficient volume of leads and opportunities to realistically achieve the overall sales target.
  2. Forecast Accuracy — how accurately the team assesses its performance potential (the gap between projected and actual closed revenue).
  3. Sales Team Effectiveness — comparison of performance across different teams, regions, or branches.
  4. Process Bottlenecks — analysis of the stage where the company consistently loses customers, regardless of the individual manager.
  5. Customer Acquisition Cost (CAC) — how cost-effective marketing and sales investments are compared to the revenue generated.

KPIs for Customer Service and Support Teams

In customer service, CRM functionality is focused on retention and maintaining a high standard of service quality. KPI monitoring in this area is primarily based on time-based and quality metrics. Key service KPIs include:
  • SLA Compliance — the percentage of requests handled within the agreed timeframe. Example: The CRM shows that 15% of requests from key customers are processed in breach of SLA. This insight enables the team to quickly adjust shift schedules or configure automated reminders to ensure timely responses.
  • First Response Time — how quickly the team reacts to a customer inquiry.
  • Resolution Time — the average time required to close a ticket, helping assess process efficiency.
  • Backlog and Ticket Categories — the number of unresolved requests and their classification. Example: An increase in tickets related to delivery delays or billing errors signals the need to optimize logistics or invoicing processes.
  • CSAT (Customer Satisfaction Score) — a metric that measures how satisfied a customer is with a specific interaction or service. Typically, customers are asked to rate their experience on a scale (e.g., 1–5 or 1–10) after contacting support, making a purchase, or using a product. Example: After a ticket is closed, the customer receives a short survey. If most ratings are low, this helps identify problematic processes, such as slow response times or an unintuitive product interface.
The CRM system automatically tracks all these metrics, stores historical data, and enables trend analysis — for example, whether customer satisfaction improves after service changes are implemented.

KPIs for Marketing

For marketing, both the quantity and quality of leads matter — along with their impact on sales and overall revenue contribution. Key marketing KPIs tracked in a CRM include:
  • Lead Conversion by Channel — this metric shows how many leads from a specific source progress to the opportunity or deal stage. For example, Facebook Ads, SEO, webinars, or partner programs. Within the CRM, channels can be compared not only by the number of inquiries generated, but by actual performance — specifically, which leads convert into revenue.
  • Customer Acquisition Cost (CAC) — combined with conversion data, CAC helps calculate the ROI of marketing campaigns and determine which investments generate returns and which should be optimized or reallocated.
  • Revenue Contribution — this KPI reflects the real financial impact of marketing activities. The CRM links each lead to a closed deal and the revenue it generated. This makes it possible to identify which channels produce profitable leads and which merely increase traffic without meaningful revenue impact.
  • Sales Cycle by Lead Source — measures the time from first contact to deal closure for leads coming from different channels. This helps identify which channels generate faster wins and which involve longer cycles, enabling better resource planning and sales prioritization.
  • Content and Campaign Effectiveness — tracks which materials or activities move leads forward in the funnel.
Request a consultation

How to Implement CRM Reporting Standards and Bring Order to Data and KPIs — Without Team Resistance

Implementing reporting standards is a management process. The key is to start with foundational rules and gradually build a data-driven culture.

Start with a Minimum Required Data Set

Effective CRM reporting begins with a minimal yet critical set of data — without it, analytics lose their meaning. For each lead or deal, this typically includes:
  • Customer contact details and interaction history (calls, emails, meetings, agreements)
  • Lead source
  • Current status or pipeline stage
  • Assigned specialist
  • Next step and planned action
These fields should be mandatory by default. They form the foundation for reports, KPIs, and overall business analytics.

Standardize Statuses, Stages, and Reference Lists

If your CRM simultaneously includes statuses such as “In Progress,” “Ongoing,” and “Being Processed,” the system cannot calculate performance metrics accurately. For the CRM to function as a true business performance management tool, you need to:
  1. Approve a unified pipeline stage structure
  2. Standardize loss reasons and deal closure reasons — managers should select from a predefined list rather than entering free-text explanations. This enables accurate analysis of why deals are lost or successfully closed
  3. Standardize lead sources and ticket/request categories

Link KPIs to Actual CRM Actions

The key rule: every KPI must be directly driven by actions performed within the CRM system. For example:
  • First response time is calculated automatically — from the moment a lead is created to the first recorded interaction with the customer, with no manual tracking required.
  • Sales activity is based on real CRM actions: calls, meetings, and communications logged in the system.
  • Sales target achievement is calculated from actually closed deals in the CRM — not from external spreadsheets or separate files.

Show the Team the Practical Value of Reports

For CRM reporting to become part of daily operations, the team must see clear personal value in it. In practice, this means:
  1. A sales manager can instantly see which deals require attention today.
  2. A team lead can identify where the funnel is slowing down — and why.
  3. Marketing can see which channels genuinely generate profit.
  4. Service teams can detect potential SLA breach risks before they escalate.

Implement Standards Gradually — Not in One Big Release

CRM reporting is not built overnight. The most effective approach is iterative implementation:
  1. Core data and pipeline
  2. Essential sales reports
  3. Leadership KPIs
  4. Service analytics
  1. Marketing metrics and business intelligence
Request a consultation

Common CRM Reporting Mistakes — and How to Avoid Them

What happens when you have data, KPIs are being calculated, yet the right decisions still don’t follow? Below are common CRM reporting mistakes and practical ways to prevent them.

Duplicate Data and Reporting Chaos

One of the most widespread issues is duplicate leads and customer records. They distort sales metrics and performance KPIs, create the illusion of activity, and prevent a clear understanding of actual business effectiveness. When Do Duplicates Appear in CRM?
  • Manual data entry by different managers — for example, one manager adds a contact using a shortened name, while another enters the full name or a different email address. The system treats them as two separate customers.
  • Imports from multiple sources without validation — when databases are uploaded from marketing campaigns, websites, or social media, the same lead often enters the system multiple times.
  • No unified customer identification rule — if the CRM does not rely on a clear unique identifier (such as email or phone number), it cannot automatically merge duplicates.
  • Automated integrations without proper configuration — when the CRM is connected to multiple channels (chatbots, website forms, email marketing tools) without deduplication rules, the same customer may be created as a new record each time.
How to avoid it: Set up automated data capture and regular database audit, so the CRM system can track performance metrics without “data noise.”

Undefined Process Stages

When sales pipeline stages lack clear rules, managers don’t fully understand what qualifies as an “active deal” or a “prospect” (a potential customer who has shown interest but has not yet purchased). How to avoid it: Define clear stage criteria and implement reports with structured categories and real-time KPIs that track the company’s core performance metrics.

“Dead” Activities

Tasks without defined next steps are a strong signal that a deal has effectively stalled. These “dead” activities reduce productivity and lead conversion rates. How to avoid it: Introduce a rule that no deal can remain without an active task. This helps maintain sales momentum and provides better visibility into sales team effectiveness.

Too Many Dashboards

When a company creates dozens of reports, managers become overwhelmed by data. Instead of enabling decision-making, reporting turns into information noise. How to avoid it: Streamline your CRM tools and focus only on the core business KPIs — average deal size, lead conversion rate, revenue, customer satisfaction, and others.

No Data Owner

If no one is responsible for data quality, the CRM becomes a storage system rather than a business optimization tool. How to avoid it: Appoint a data owner within the team who is accountable for reporting accuracy and ensures that performance evaluations are based on reliable data.

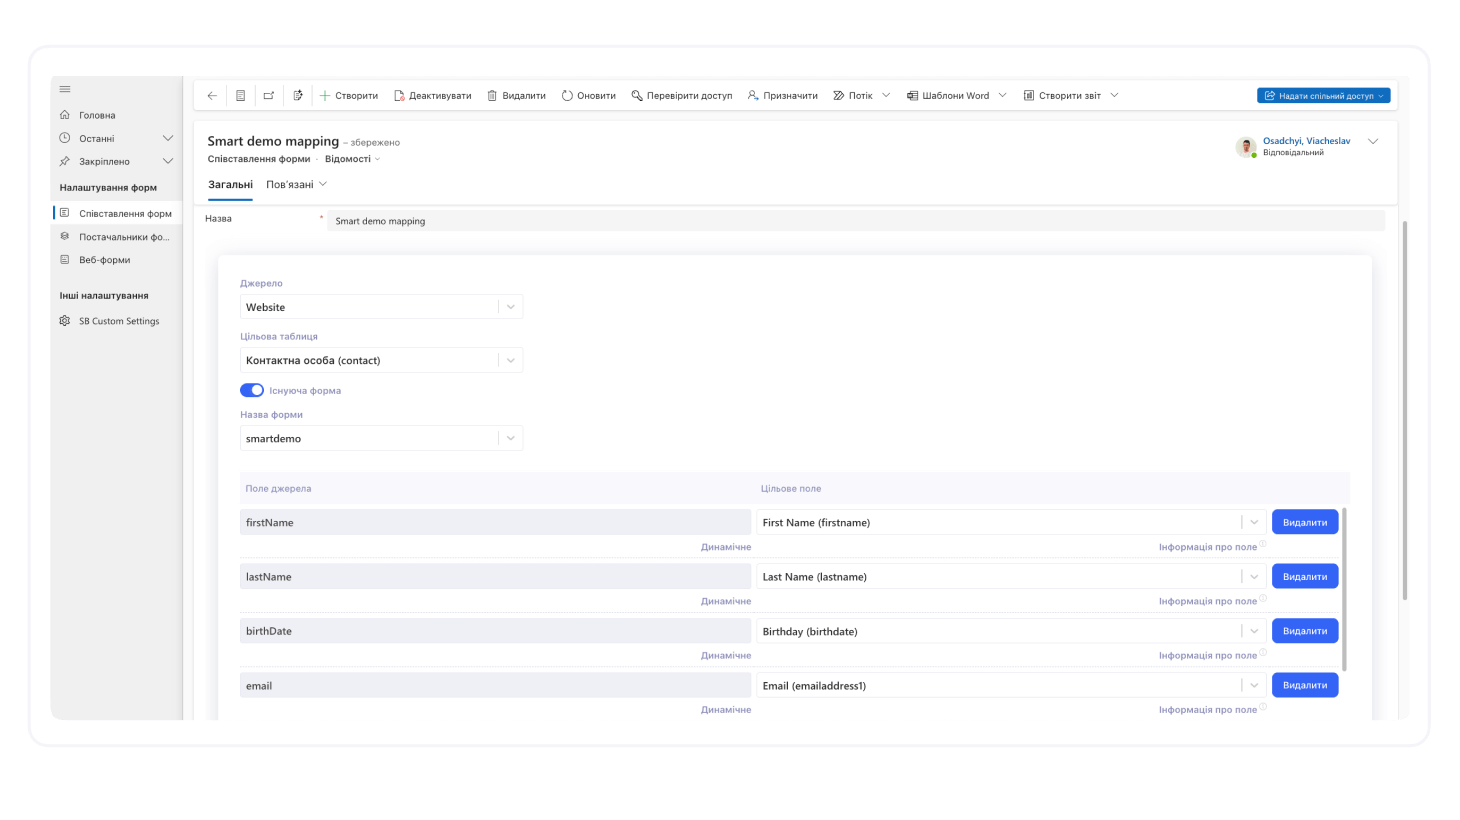
Inconsistent Lead Sources

When lead sources are not standardized, the company cannot accurately forecast marketing performance or calculate customer acquisition cost. How to avoid it: Standardize data collection processes and establish a single source of truth for business analytics.

Ignoring the Customer Dimension

Many reports focus exclusively on sales metrics while overlooking customer satisfaction. Without this perspective, it’s impossible to fully assess the real value of customer interactions. Solution: Incorporate customer-focused KPIs into your reporting framework to gain a comprehensive view of overall business performance.
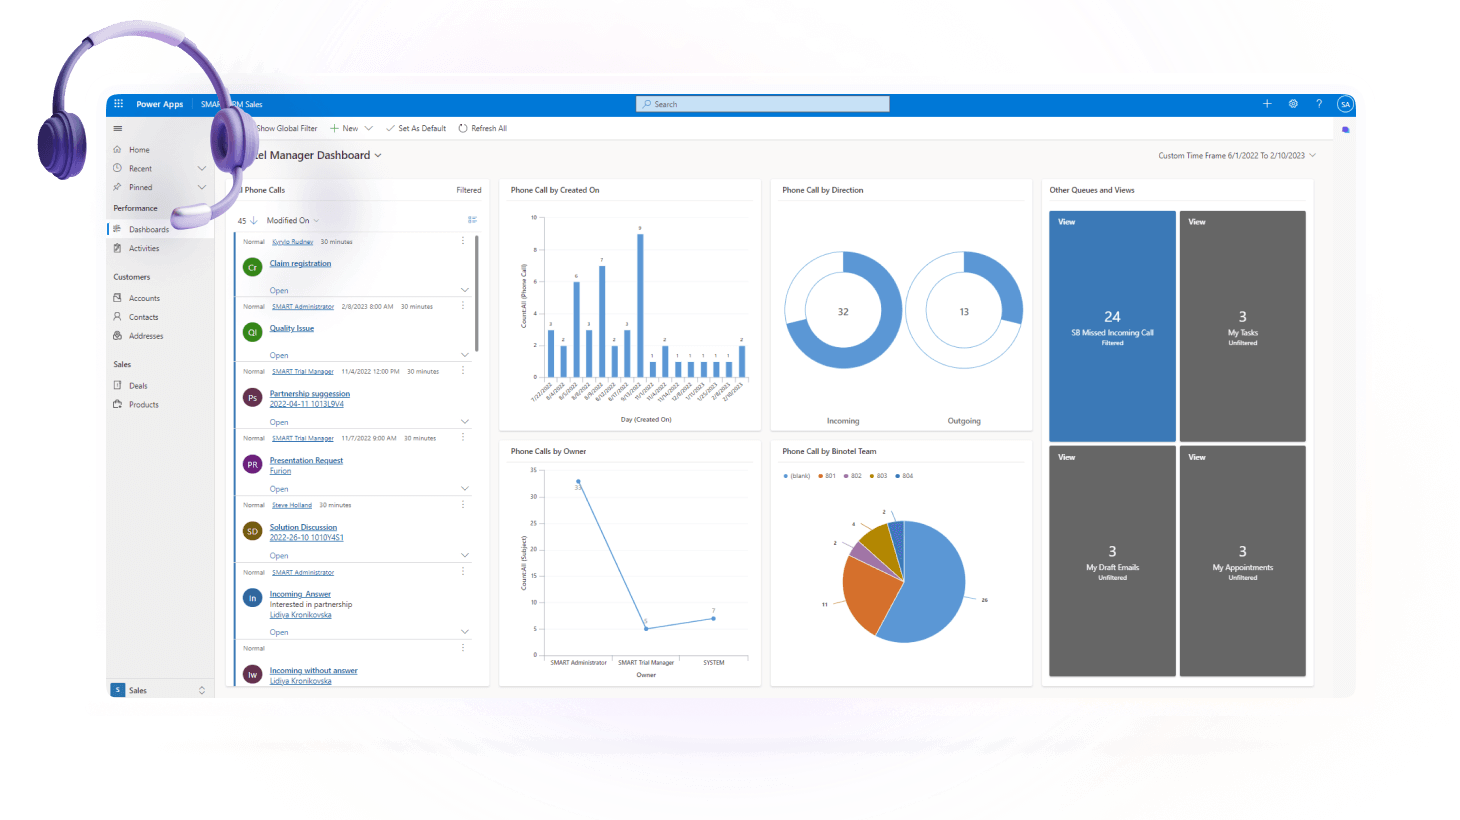
   Explore the article “‎CRM Reporting in Action: Dashboard Examples in SMART CRM Platform Solutions” to see how reports, KPIs, and analytical dashboards are visualized and used in practice. If your company aims to maintain full visibility into business performance — from lead movement and team efficiency to marketing channel results — the SMART business team will help you select a CRM solution with powerful analytics, where everything is clear, easy to track, and designed to make process management simple and transparent. Request a consultation
14 min read
Image of a thoughtful businessman choosing a CRM solution, surrounded by software interface windows
Best CRM Systems in 2026: Which One Should You Choose?
In 2026, a CRM system serves as the central hub for managing business processes. It is a comprehensive operational platform that coordinates marketing, service, and analytics. CRM functionality continues to evolve: AI modules are being introduced, processes are automated, and BI integrations are optimized. Businesses quickly adapt to this new level of technological maturity — and just as quickly begin to expect more from their CRM systems. At the same time, companies face an important decision: which system should they choose for their first implementation or to replace legacy software? The choice is complicated by the fact that the number of solutions on the market has long exceeded the actual needs of most businesses. According to forecasts, the global CRM market is expected to reach approximately $88.7 billion in 2026 — a figure that represents hundreds of platforms with similar functionality but different operating logic. So how do you choose a solution that truly fits your company’s needs? In this article, we present a ranking of the most popular CRM systems, a comparative table of their key capabilities, and practical selection criteria tailored to different types of businesses.

CRM Ranking 2026: How It’s Formed and How to Make Sense of It

Typically, information used to compare business solutions is based on customer satisfaction and market presence. However, when creating an overall CRM ranking, platforms should be evaluated according to a set of practical criteria:
  • Sales and service functionality: How well the CRM supports the full customer lifecycle (pipeline management, leads, deals, and customer support). The more complete the functionality, the fewer third-party apps you’ll need to connect.
  • Process automation: Whether the system allows you to set rules, triggers, and workflows without constant human intervention. This is essential for saving team time and reducing the likelihood of errors in daily operations.
  • Reporting and analytics: Whether the CRM provides standard and custom reports, KPI tracking, and forecasting — enabling companies to make data-driven decisions rather than relying on intuition.
  • Integrations: The platform’s ability to connect with ERP systems, marketing platforms, telephony, e-commerce, and BI tools. The more integrations available, the easier it is to unify all business modules.
  • Ease of use: How clear and intuitive the interface is. This directly affects how quickly employees can start working effectively in the CRM.
  • Scalability: Whether the system can grow alongside the business without losing performance. It’s important that the platform can handle increasing data volumes and expanding teams.
  • Pricing model: Whether licensing is transparent, if essential features are included in basic plans, and how much implementation costs. This helps assess how cost-effective the CRM will be for the company.

Best CRM Systems of 2026: Functionality, Purpose, and Demand

Currently, the market offers businesses roughly 700 different CRM solutions. In this section, we present a selection of the seven most successful and frequently mentioned CRM systems in 2026 rankings, along with their advantages, disadvantages, and recommended use cases.

#1 Microsoft Dynamics 365 CRM

Strictly speaking, there is no single system called “Microsoft Dynamics 365 CRM.” It is an ecosystem of interconnected Microsoft Dynamics 365 solutions that together cover sales, marketing, customer service, and field service tasks. A single database (Dataverse) and seamless integration between modules form a unified CRM platform comprising the following solutions (as of February 2026): Dynamics 365 Sales (for managing the full sales cycle); Dynamics 365 Customer Insights (for creating a real-time 360° customer profile); Dynamics 365 Customer Service (for supporting customers within a single platform); Dynamics 365 Field Service (for automating on-site service delivery); Dynamics 365 Contact Center (х a cloud-based solution for omnichannel customer support).
  • Advantages: Deep integration with the Microsoft ecosystem (Microsoft 365, Teams, Power Platform, Azure), high scalability, flexible process customization, advanced analytics and AI capabilities via Copilot. It’s a reliable and convenient system that can be assembled like a modular toolkit to form a solid foundation for automating processes in any business.
  • Disadvantages: More complex licensing logic compared to “classic” CRMs, may require upfront architecture and process planning, especially for large-scale implementations.
  • Who it’s for: Medium and large companies already using Microsoft products and needing a modular, scalable CRM ecosystem.
Customer cases: BROCARD, Ecosoft, EY, JTI, Lenovo, and others.

#2 SMART CRM

SMART CRM is a system developed by SMART business. The solution’s functionality includes AI-driven automation, flexible adaptation to business processes, and integration with the company’s existing IT ecosystems. SMART CRM is built on Microsoft technologies (which makes it convenient to combine with other solutions within the ecosystem) but is more affordable than Microsoft Dynamics 365. The solution offers four modules designed to address different business needs: SMART Sales, SMART Marketing, SMART Customer Care, and SMART Order Management. Advantages:
  • 360-degree customer view
  • Easy integration with other services
  • Built-in analytics and AI automation
  • Creation of omnichannel communication with existing and potential customers
  • Convenient tools for task and team management
  • Availability of a mobile version and cloud access
  • Flexibility and scalability
Who it’s for: small and medium-sized businesses, as well as large teams with complex sales cycles. SMART CRM is optimal if your business deals with large volumes of data, requires automation, and needs adaptation to specific processes without coding (low-code/no-code). Thanks to its flexible architecture, it scales well and supports a hybrid operating model (online/offline). Customer cases: Nova Post, DTEK, AM Integrator (more cases available in the blog).

#3 Salesforce CRM

Salesforce is well known in the global CRM market, but it is difficult to call it universal. Its scalable architecture is best suited for large companies that require flexible customization of sales, marketing, service, and analytics processes.
  • Advantages: very deep customization for specific industry requirements, advanced AI capabilities (Einstein), and a wide range of integrations and applications via AppExchange.
  • Disadvantages: high cost and implementation complexity; an interface that may seem complicated for users without professional technical expertise.
  • Who it’s for: large companies with well-developed sales infrastructure.

#4 HubSpot CRM

HubSpot CRM is often referred to as the gold standard for teams with limited technical resources. It is recognized as one of the most intuitive platforms, without complex configurations. Currently, HubSpot offers customers an “all-in-one” approach that combines marketing, sales, and service processes within a single system.
  • Advantages: ease of use, well-designed UX, integrated marketing and analytics, free starter plan.
  • Disadvantages: more advanced features can be expensive in professional-tier packages.
  • Who it’s for: startups and small to medium-sized businesses where fast implementation and an intuitive interface are essential.

#5 Pipedrive CRM

Pipedrive is known as a sales-focused CRM with convenient deal pipeline visualization and a quick start. It is simple and user-oriented, which makes it genuinely easy to use. The main drawback is that the system remains relatively manual and somewhat lags behind the pace of automation progress (some popular integrations may be introduced later than the broader market or aligning the functionality of new modules may take additional time).
  • Advantages: minimal setup time, intuitive interface, strong focus on solving sales tasks.
  • Disadvantages: limited marketing and service capabilities without additional integrations (for example, the lack of built-in email marketing tools).
  • Who it’s for: small companies and sales teams primarily focused on closing deals.

#6 Zoho CRM

Zoho CRM offers a broad set of features for process automation and deep integration with other business applications within the Zoho suite. Initially, the system was marketed as a more affordable alternative to Salesforce with comparable functionality.
  • Advantages: comprehensive feature set, flexible configuration, relatively affordable pricing.
  • Disadvantages: the interface may feel overloaded, and some features require training.
  • Who it’s for: companies with mid-sized sales operations that want a powerful CRM with room for expansion.

#7. Freshworks CRM

Freshworks CRM offers a wider range of functionality and a more user-friendly interface than Zoho. However, user reviews note that the rapid expansion of features sometimes makes the system feel bulky and not always fully refined.
  • Advantages: fast implementation and easy onboarding, built-in AI features, good balance between price and capabilities.
  • Disadvantages: less customization compared to large enterprise platforms; additional fees may apply for customization and the rollout of new features.
  • Who it’s for: small and medium-sized businesses that value speed of launch.

At a Glance: CRM Ranking 2026 Comparison Table

CRM System Best For Primary Purpose Automation Level Implementation Entry Barrier
Microsoft Dynamics 365 CRM Mid/ Enterprise Sales, service, marketing, analytics High Partner-led High
SMART CRM SMB / Mid /  Enterprise Sales, service, analytics High Partner-led / Hybrid Medium
Salesforce Mid / Enterprise Sales, marketing, service High Partner-led High
HubSpot CRM SMB / Mid Sales, marketing Medium Self-implementation Low
Pipedrive SMB Sales Low Self-implementation Low
Zoho CRM SMB / Mid Sales, service Medium Self-implementation / Partner-led Low/Medium
Freshworks CRM SMB / Mid Sales, service Medium Self-implementation Low/Medium

H2 Key Selection Criteria: How to Determine Whether a CRM System Is Right for Your Company

It is important to note that a ranking does not provide a universal answer to the selection question. Even a top-rated CRM may prove ineffective if its logic does not align with a company’s internal processes. That is why lists of “best solutions” should be combined with an analysis of your own business processes, user roles, and strategic goals.

Key CRM selection criteria:

  • Team size and structure A CRM for a team of five managers and one for an organization with multiple sales departments represent entirely different scenarios. The larger the team, the more critical roles, access rights, change control, and system scalability become.
  • Process type: sales, service, or both As shown in the ranking, some CRMs excel at managing sales pipelines, while others are stronger in service support and handling customer requests. If your business operates with long sales cycles or post-sale service processes, the system should support these at the core solution level rather than through add-on modules.
  • Complexity of pipelines and business logic A simple linear pipeline and multi-level scenarios with multiple decision points require different levels of CRM flexibility. It is important to assess whether the system allows you to configure stages, transition conditions, and exceptions without complex additional customization.
  • Reporting and management analytics A CRM should effectively transform data into management decisions. If plan-vs-actual tracking, forecasting, KPI monitoring, or analytics by team and region are critical for you, these capabilities should be evaluated from the outset.
  • Process automation Manual work can quickly become a bottleneck as a business grows. It is worth assessing which actions the CRM can automate: for example, task creation, reminders, status updates, notifications, and workflow triggers without manager involvement.
  • Integrations with other systems A CRM rarely operates in isolation. The seamless integration with ERP systems, accounting software, marketing platforms, telephony, or e-commerce directly affects data consistency and team efficiency.
  • Data management, security, and access rights For companies with a clear hierarchy and strict data control requirements, it is important that the CRM supports flexible access configuration, change history tracking, and clear responsibility boundaries between roles.
Before making a final decision on a CRM solution for your company, it is worth documenting answers to a few simple questions:
  • Which processes need to be automated first?
  • How many people will realistically be using the system one year after implementation?
  • What reports does management need for decision-making?
  • Which systems must the CRM be integrated with from day one?
  • How critical is the future development and expansion of the solution?

Common Mistakes When Choosing a CRM System: What to Watch Out For

CRM rankings can make navigating the market much easier, but if used incorrectly, they can sometimes create false expectations. The key problem usually isn’t with the solutions themselves, but with the mistakes a company makes when selecting software:
  1. Comparing features without considering process logic In most CRM rankings, systems appear equally functional: pipelines, automation, analytics, integrations. However, during implementation, it often becomes clear that the technical logic behind these processes differs significantly.
For example, Pipedrive handles basic deal management scenarios well, but for complex, multi-level processes, it eventually requires manual work or third-party integrations. In contrast, SMART CRM or the Microsoft Dynamics 365 CRM ecosystem allow process logic to be adapted to the business with minimal changes.
  • Tip: Before choosing a CRM, model your actual business processes in the system or a test environment — check whether the CRM supports your scenarios “out of the box.”
  1. Focusing on licenses instead of total implementation cost Rankings often compare CRMs based on entry cost, but they don’t show the real expenses after launch. For instance, HubSpot CRM looks attractive due to its free trial, but when scaling marketing, automation, or analytics, the cost of professional packages can rise disproportionately fast.
In corporate solutions like Salesforce or Microsoft Dynamics 365 CRM, the main expenses are usually not the licenses themselves, but designing the architecture, integrations, and customization.
  • Tip: Evaluate not only the initial license cost but also the projected expenses for customization, integrations, and maintenance over the next 1–2 years.
  1. Ignoring CRM adoption by the team A functionally strong system doesn’t guarantee real usage. For example, Salesforce offers extremely deep customization, but without training and a clear process design, users often perceive the system as complex, which can lead to resistance and reluctance to use it.
Meanwhile, HubSpot CRM or Freshworks CRM benefit from a simple interface and quick onboarding, which is critical for small teams or businesses without internal IT resources.
  • Tip: Evaluate the system’s ease of use for your team, run a pilot implementation, and provide thorough user training.
  1. Lack of distinction between B2B and B2C scenarios Many CRM rankings evaluate systems universally, even though B2B and B2C requirements differ significantly. For example, Zoho CRM or Freshworks CRM work well for mass sales and standard processes, but for complex B2B deals with multiple roles, long cycles, and approval stages, businesses quickly encounter limitations. This is where SMART CRM or Microsoft Dynamics 365 CRM stand out, as they allow building processes around roles, access rights, and advanced analytics.
  • Tip: Identify your business type (B2B, B2C, or hybrid) and check whether the CRM supports the necessary scenarios, including roles, access rights, and analytics.
  1. Misjudging the complexity of data migration Migrating historical data — contacts, deals, activities — remains one of the riskiest stages of a CRM project but is rarely reflected in rankings. For ecosystem solutions, migration is usually planned as a separate stage with prior data preparation. In “lightweight” CRMs, this process often looks simpler on paper, but real limitations become apparent during import.
  • Tip: Before implementation, clarify how the CRM handles large volumes of historical data and plan migration as a separate project with a test import.

CRM System Rankings 2026: Summary and Final Choice

The 2026 CRM rankings show that there’s no one-size-fits-all solution — instead, there are platforms better suited for specific business types:
  • Small businesses and startups usually choose CRMs with a low entry barrier, quick launch, and minimal customization needs.
  • Growing sales teams need CRMs with flexible pipelines, task automation, and basic management analytics.
  • Service-oriented businesses focus on request handling, SLA tracking, client history, and transparent communications.
  • B2B companies with long deal cycles look for solutions that support complex approval scenarios, roles, and multi-level analytics.
  • Enterprise organizations typically choose a CRM as part of a larger IT ecosystem, integrated with ERP, BI, and corporate services.
Regardless of business size, it’s advisable to conduct a brief process analysis and form a basic implementation plan before making a final CRM choice. SMART business, a vendor with 17 years of experience in business automation solutions, can assist you with this. If you want to select a system tailored to your company’s needs, submit a request, and SMART business specialists will be happy to help. Request a consultation
mail
SMART CRM
Cookies

We use cookies to improve your web experience, display personalized content and analyze traffic. By clicking «Accept All», you agree to their use. To manage your settings, click Settings. Learn more about the use of cookies in the privacy policy.

Functional
Always active
The technical storage or access is strictly necessary for the legitimate purpose of enabling the use of a specific service explicitly requested by the subscriber or user, or for the sole purpose of carrying out the transmission of a communication over an electronic communications network.
Marketing
The technical storage or access is required to create user profiles to send advertising, or to track the user on a website or across several websites for similar marketing purposes.
Statistics
The technical storage or access that is used exclusively for statistical purposes
Analytics
Analytical purposes are used to measure traffic and optimize content.