A connector to the Polish delivery service InPost, enabling the creation of shipping waybills for customer orders directly during processing in the CRM.
Request a demo
Features of the connector
- Create, issue, delete, or cancel shipments directly from SMART CRM or Microsoft Dynamics 365 solutions.
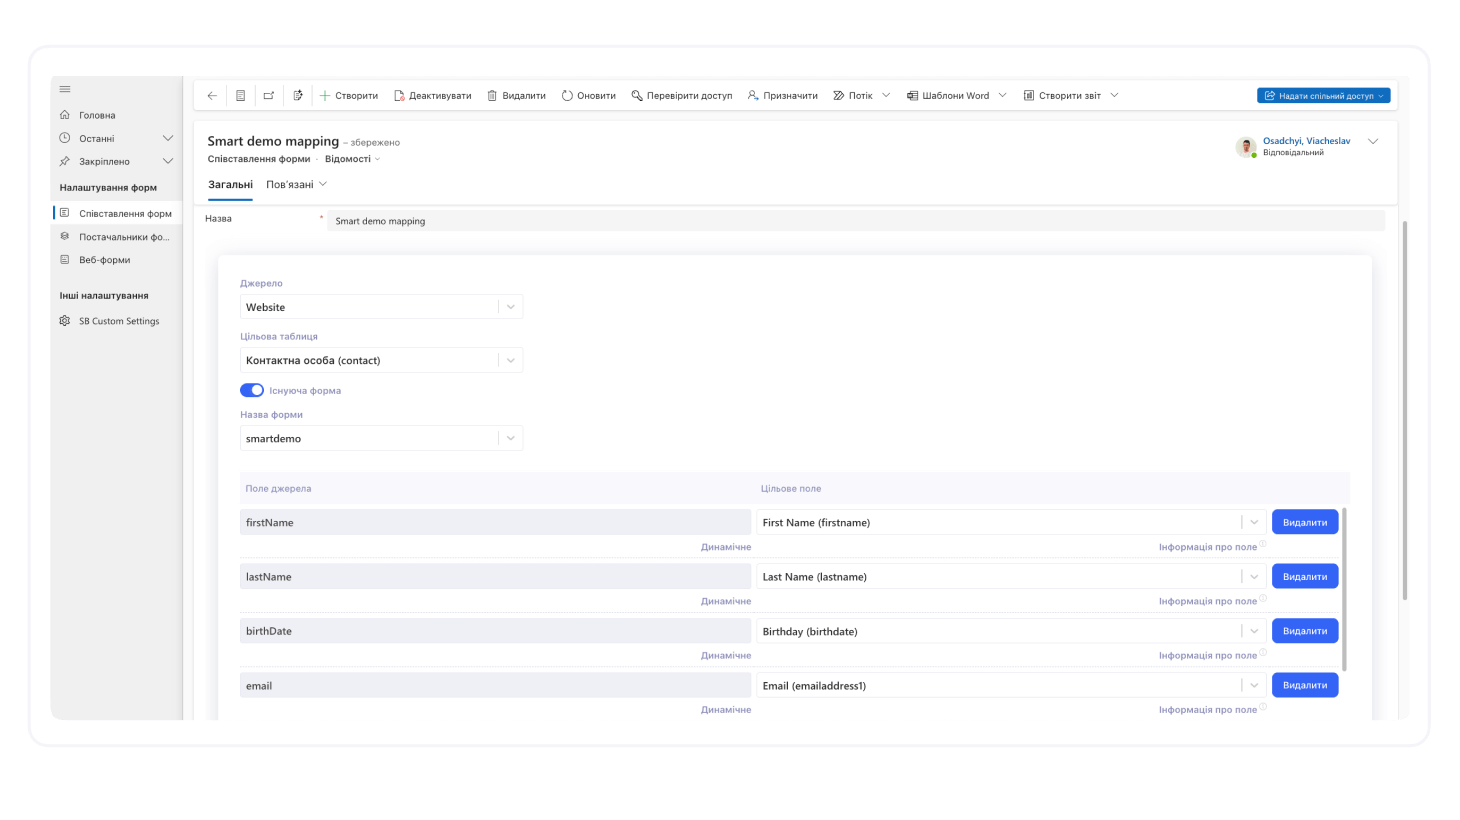
- Manage shipments and create reusable templates for different parcel sizes.
- Print waybills in multiple formats.
- Automatically retrieve shipment statuses from the provider on a regular basis.
- Create address deliveries or shipments to parcel lockers or branches.
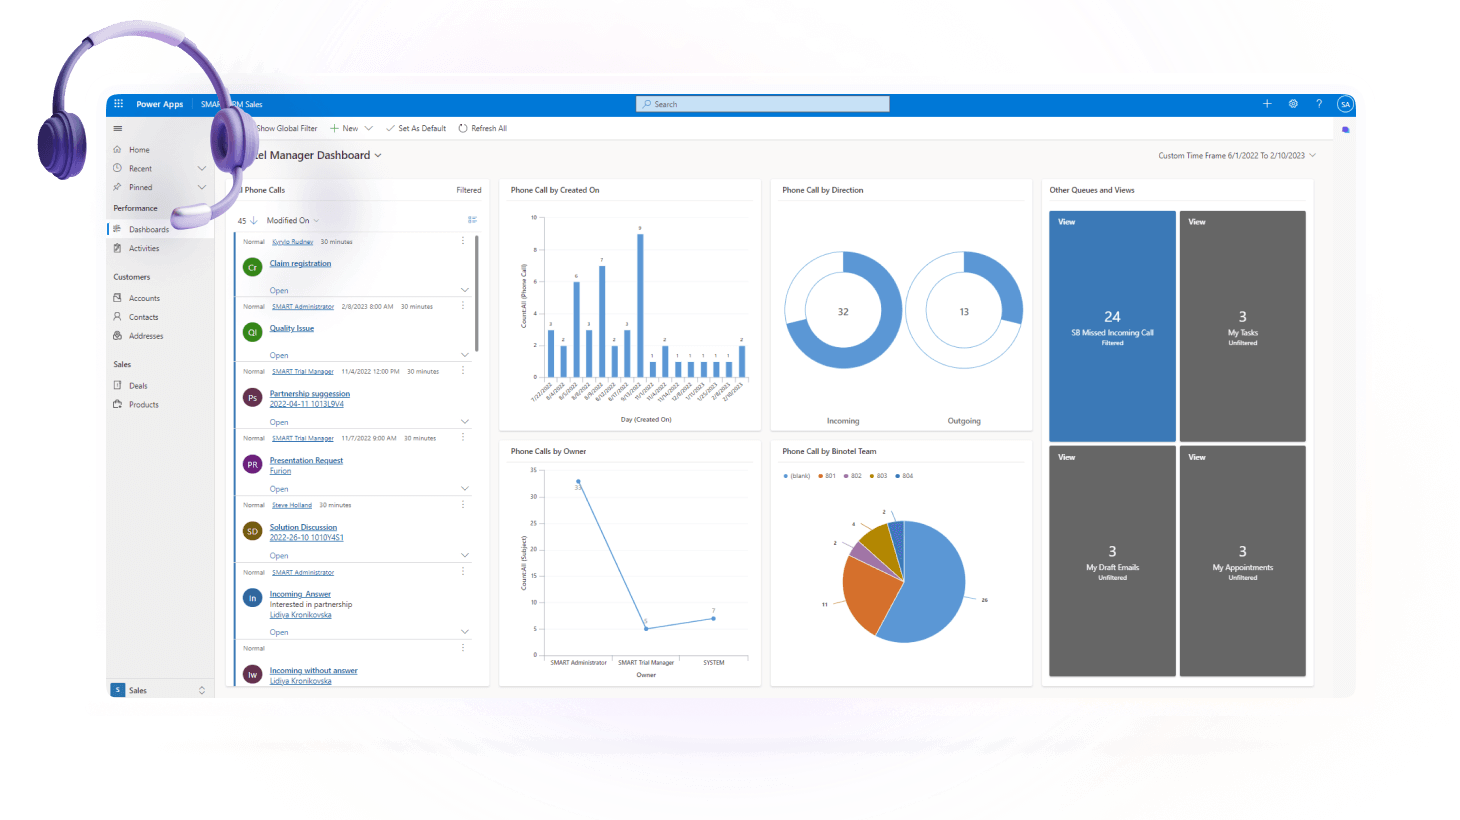
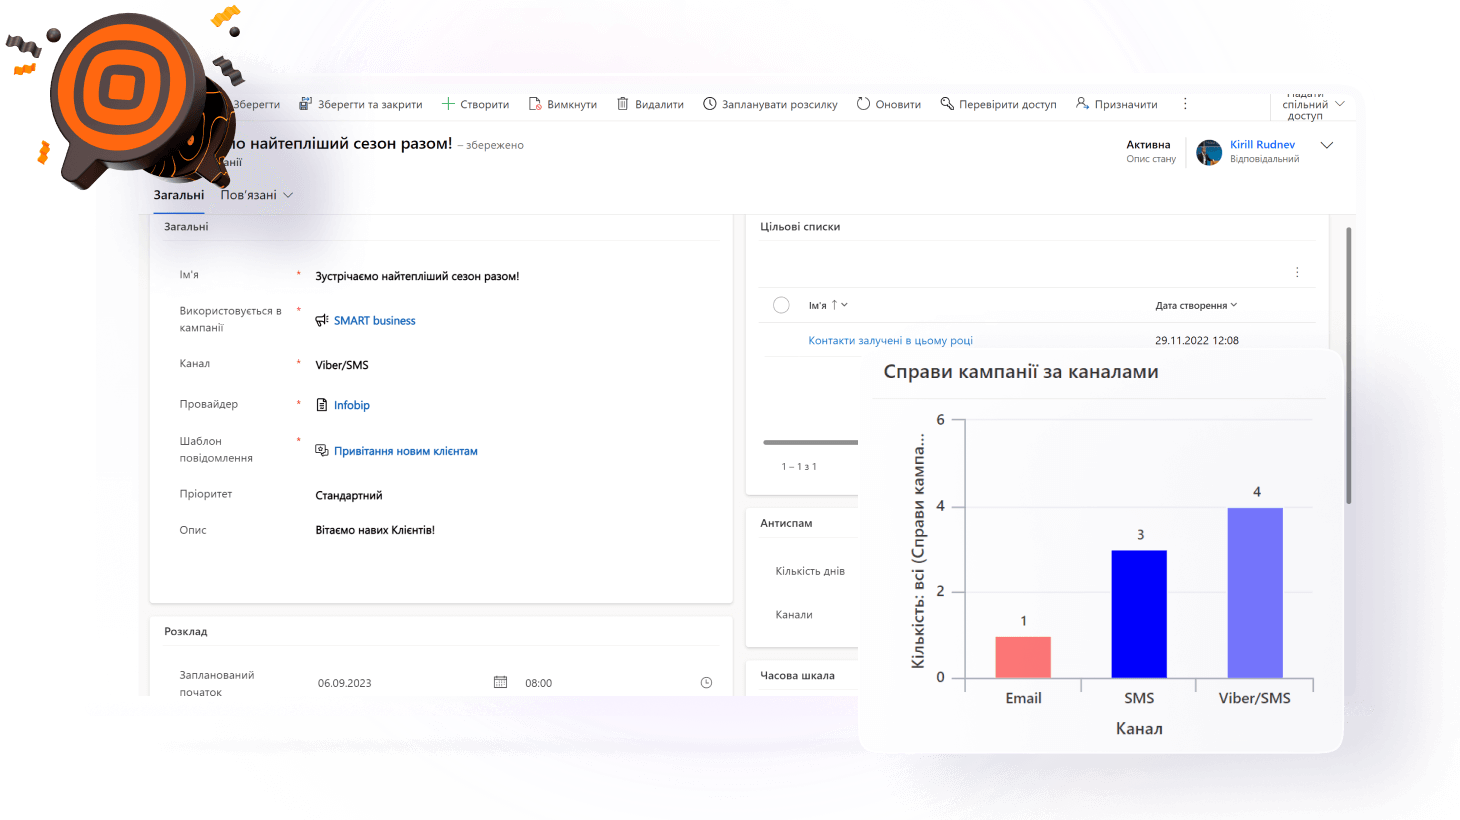
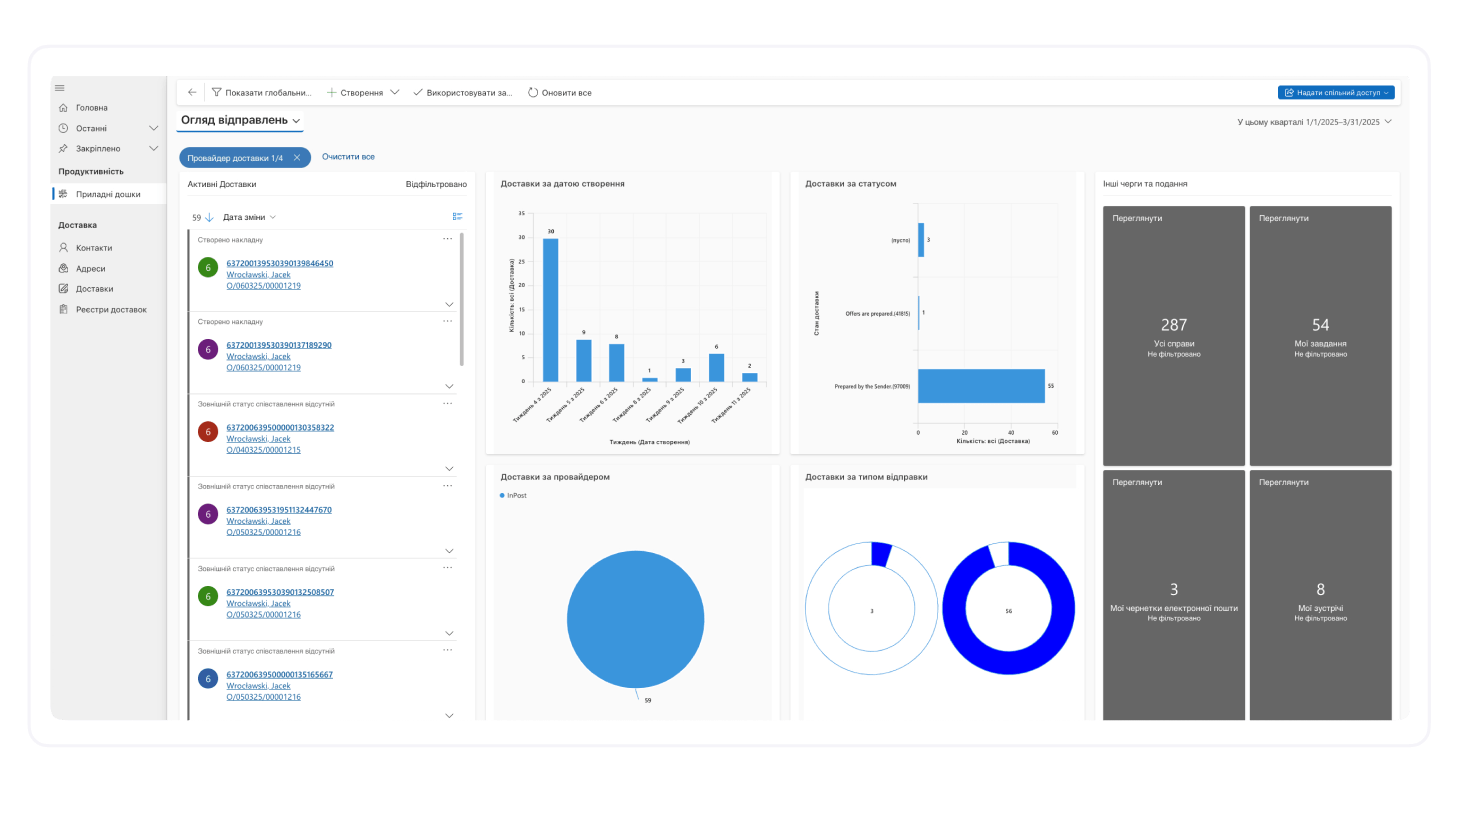
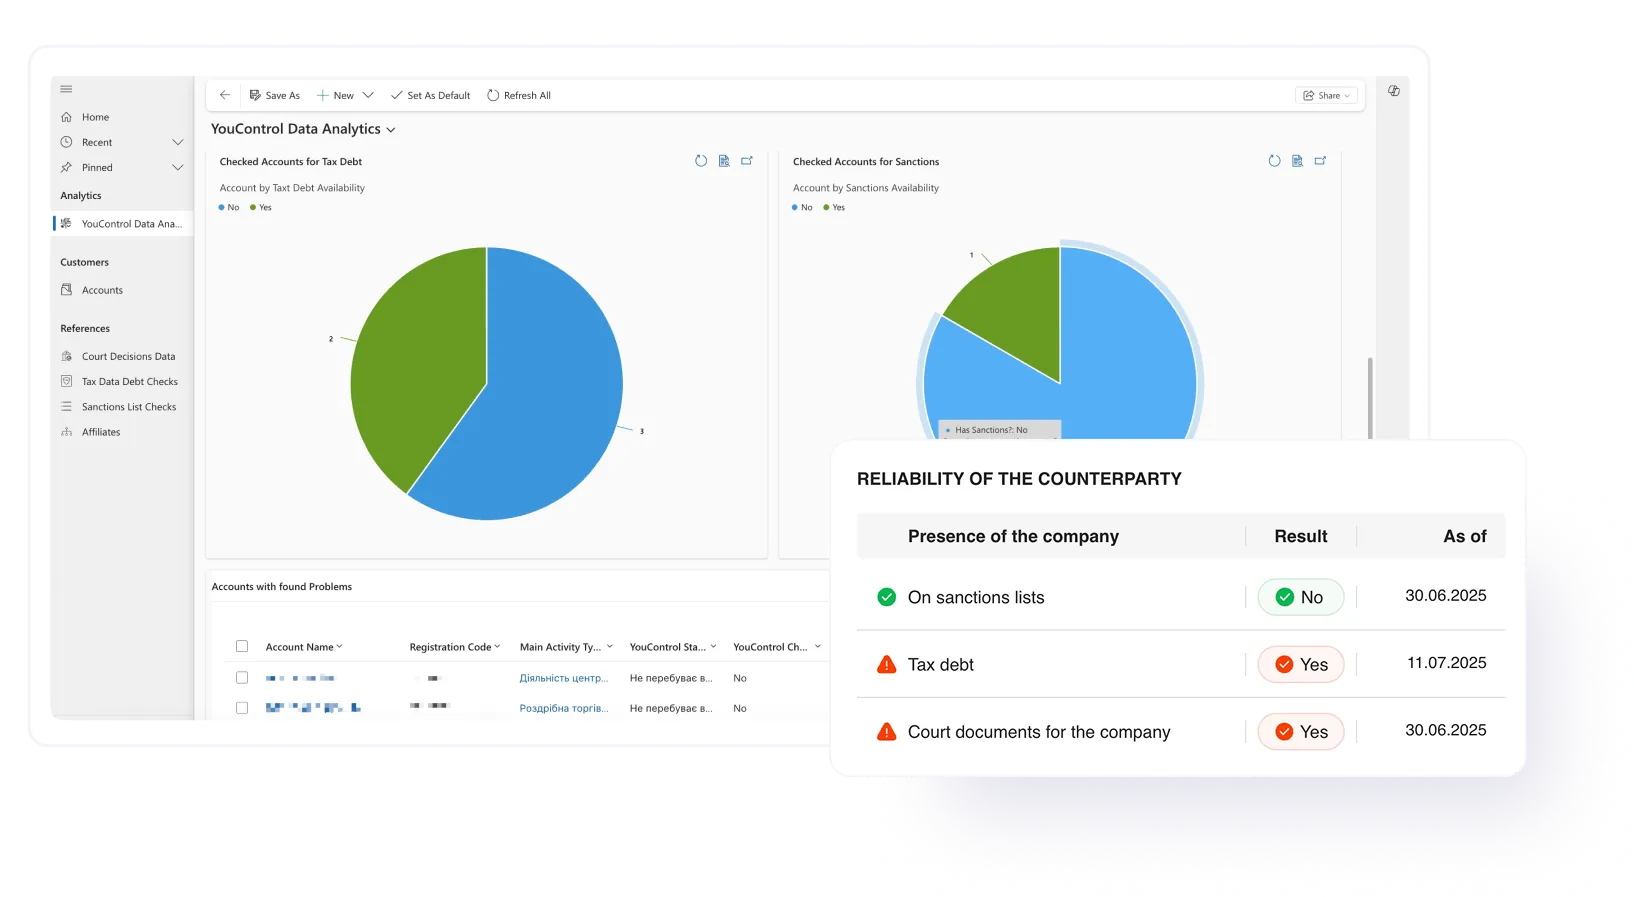
- Analyze all shipments on analytical dashboards.
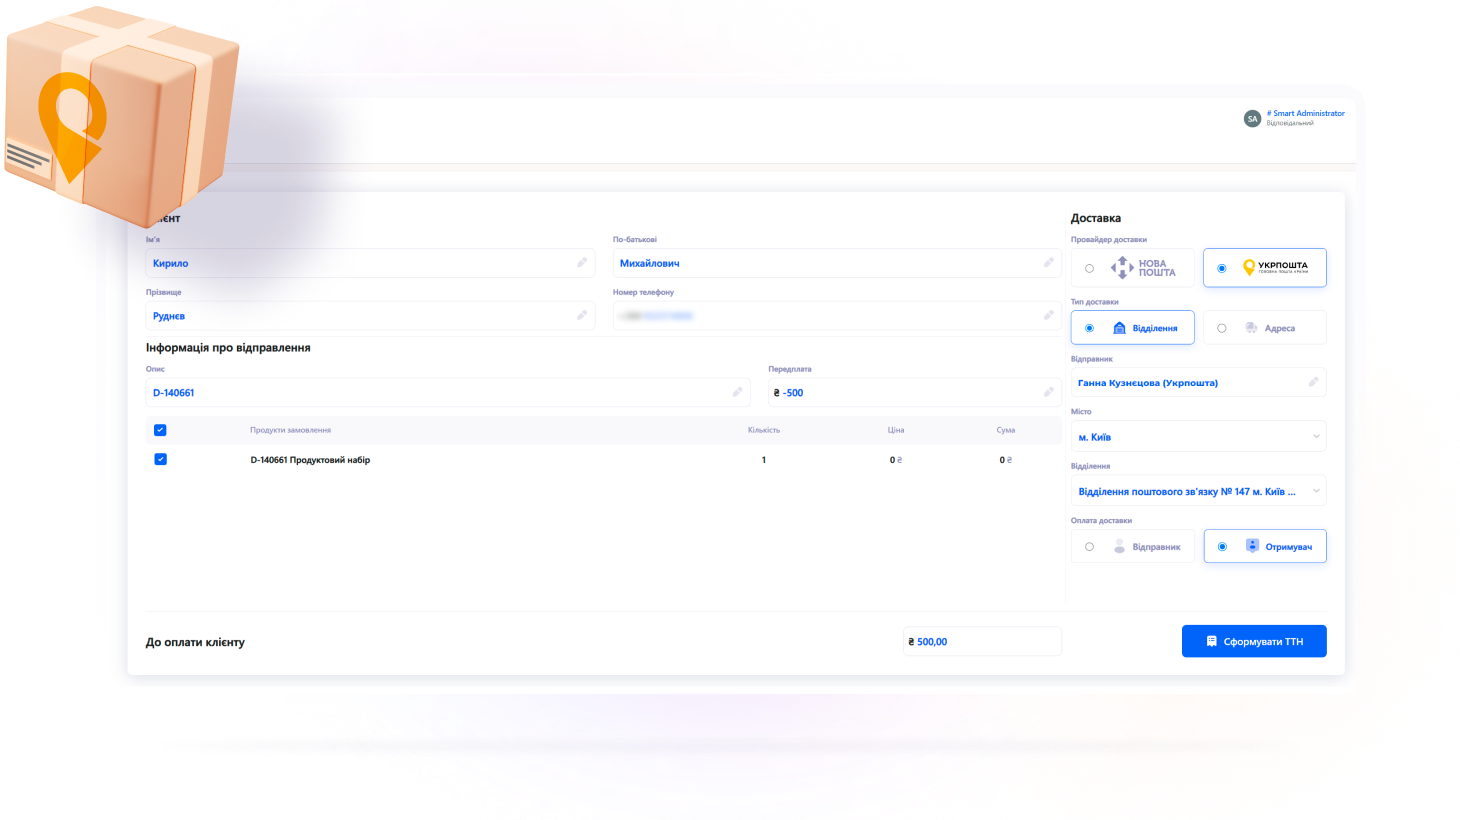
Connector for API of Ukrposhta which provides the ability to create a waybill for shipment to a branch or address shipment directly when processing an order in CRM, with subsequent synchronization of the shipment status
I want a demo
Features of the connector
- Shipment of parcels is generated, created, deleted or cancelled directly from the SMART CRM or Microsoft Dynamics 365 interface
- Senders management and creation of standard templates for different parcel sizes
- Regular automatic receipt of the shipment status from the provider
- Possibility to generate both address shipment and shipment to the branch
- Analysis of generated shipments on Analytical dashboards
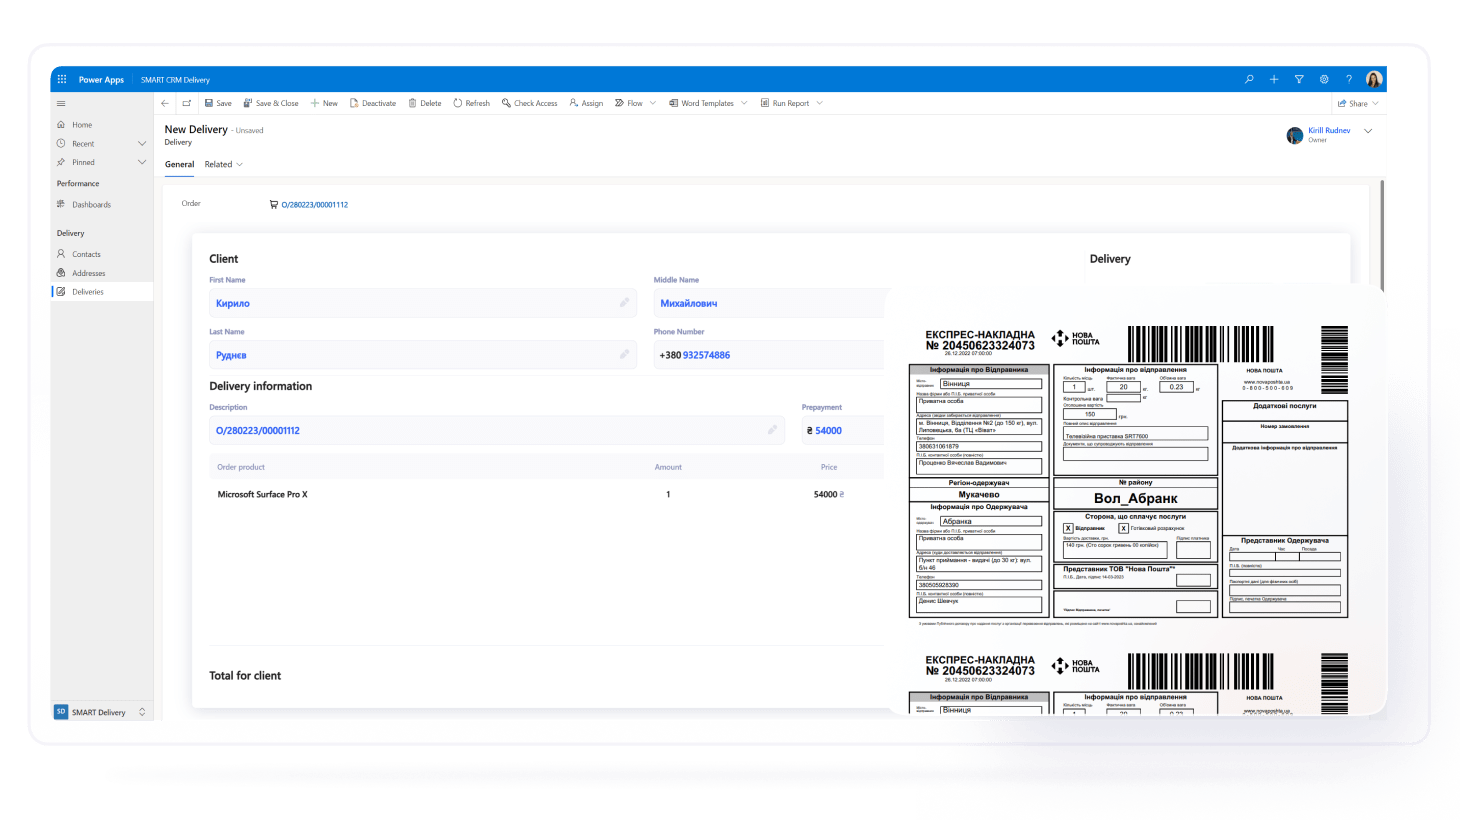
Connector for API of Nova Poshta that provides the ability to create a waybill for shipment to a branch or address shipment directly during order processing in CRM, with subsequent synchronization of the shipment status
I want a demo
Features of the connector
- Shipment of parcels is generated, created, deleted or cancelled directly from the SMART CRM or Microsoft Dynamics 365 interface
- Senders management and creation of standard templates for different parcel sizes
- Printing out waybills in various formats
- Generatng and filling of registers of NP shipments from the SMART CRM or Microsoft Dynamics 365 interface
- Regular automatic receipt of the shipment status from the provider.
- Possibility to generate both address shipment and shipment to the branch
- Analysis of generated shipments on Analytical dashboards