Order a demo

CRM Reporting: From Sales to Service — KPIs, Management Best Practices, Reports, and Business Analytics

visualization of business operations with analytical reporting

According to Fortune Business Insights, a leading international market research and consulting company, the global CRM market continues to demonstrate steady growth. While it is projected to reach USD 126.17 billion in 2026, it may grow to USD 320.99 billion by 2034. This dynamic reflects a clear and systemic trend: companies worldwide are investing in customer relationship management technologies not only to automate sales processes, but also to enhance marketing effectiveness, service performance, and management analytics.

That is why CRM reports, KPIs, and analytical dashboards are not about micromanagement. They are about establishing unified standards of work, creating shared visibility into results, and enabling CRM systems to help businesses assess performance, optimize processes, and make data-driven decisions — rather than relying on intuition or assumptions.

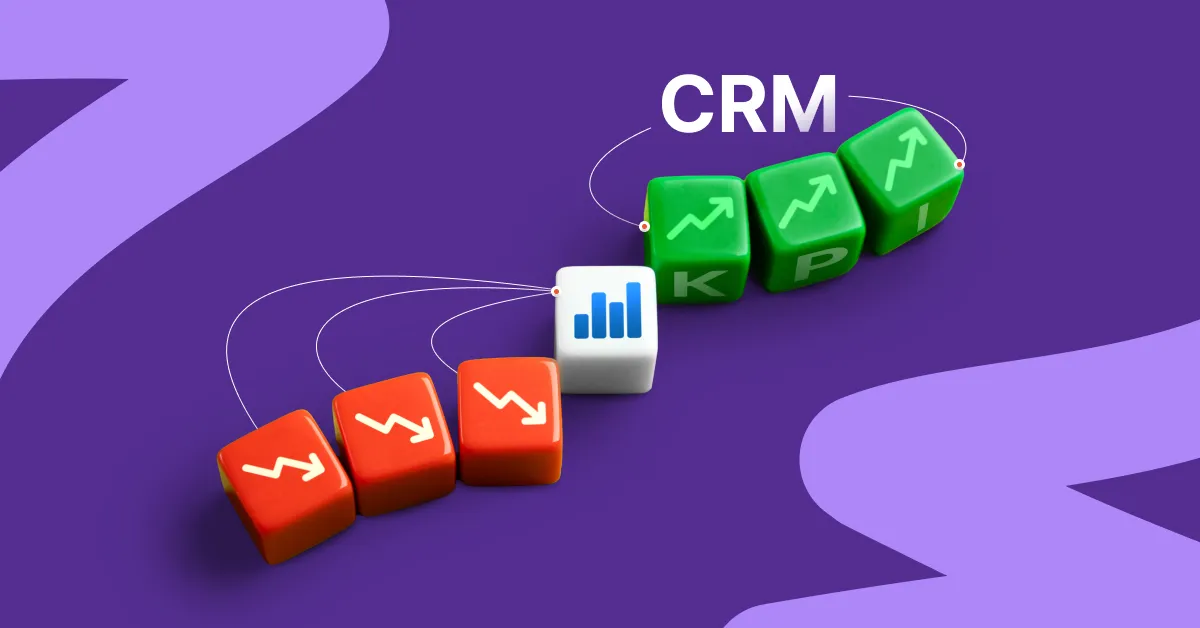
Would you like to explore the reporting capabilities of modern CRM systems right now? Submit a request and discover the reporting dashboards available on the SMART CRM platform.

Submit a request

What Is CRM Reporting and How Is It Structured?

CRM reporting is a way to structure daily work with customers and turn it into a system of measurable results. It consolidates data from sales, service, and customer interactions into a unified model where each metric has a clear business purpose. Leads, pipeline stages, manager activities, conversion rates, average deal size, and service requests become the foundation for analytics and performance evaluation within this approach.

In practice, CRM reporting is built across several levels and covers key business areas:

  • Sales pipeline — lead structure, stage-to-stage conversion rates, performance forecasting, and process stability.
  • Manager effectiveness — activities, productivity, KPI achievement, and overall sales department performance.
  • Customer interaction — quality of request handling, consistency of service processes, and adherence to established service standards, directly influencing customer satisfaction metrics.
  • Financial indicators — average deal size, customer acquisition cost, and the impact of operational processes on profitability.

A systematic approach to these reporting levels makes it possible to evaluate the effectiveness of investments in sales, marketing, and service. Analytical reports help identify trends, track performance dynamics, compare teams, and assess the effectiveness of marketing campaigns based on specific results.

Request a consultation

Key Types of CRM Reports for Effective Business Process Monitoring

There is a core set of reports without which it is impossible to gain a complete picture of sales performance and team effectiveness. Managed CRM reporting starts with these foundational reports. Additional reports can be configured for specific processes, roles, or business metrics — but they only deliver value once the core analytics framework is stable and consistently used.

Sales Pipeline Report

This report provides a full overview of all active deals — including their number, total value, stages, and assigned owners. The pipeline helps identify bottlenecks — points where deals stall or conversion rates decline. Sales managers and executives use it to:

  • prioritize deals within the team’s workload,
  • conduct weekly sales progress reviews,
  • forecast results for upcoming periods.

Example of how a report is used in CRM:

A company sees in its CRM system that out of 500 leads:

  1. 320 move from the “Qualification” stage to “Commercial Proposal”
  2. only 90 reach the “Negotiation” stage
  3. 35 deals are successfully closed

Pipeline analytics reveal a sharp drop in conversion specifically between the “Commercial Proposal” and “Negotiation” stages. Additional CRM analysis shows that:

  • managers send proposals with a 2–3 day delay
  • in some deals, no follow-up calls are logged after the proposal is sent

Based on these insights, the company takes the following actions:

  1. Introduces a Mandatory, Automated Follow-Up Standard After Sending a Proposal

A rule is configured in the CRM: once a commercial proposal is marked as sent, the system automatically triggers a control timer. The time of sending becomes the trigger for workflow automation:

  • the CRM automatically creates a task for the manager to call the client within 24 hours,
  • sets a deadline and reminder without manager involvement,
  • prevents stage changes if no activity has been logged,
  • records compliance or violations of the standard in activity reports.

If no call is logged within the defined timeframe, the CRM flags the deal as at risk or marks it as a process deviation. As a result, proposals no longer “sit” without feedback, and follow-ups become a structured, transparent part of the pipeline. In activity reports, managers can see not only whether contact was made, but also whether it was timely. This makes it possible to directly link follow-up discipline to conversion at the proposal stage and overall sales performance.

  1. Revises Commercial Proposal Templates

CRM analytics show that deals with similar characteristics (customer segment, product type, deal size) produce different outcomes after proposals are sent. This signals the need to revise the proposal templates themselves:

  • overly generic or overly technical sections are shortened
  • clear next steps for the customer are added (what to do after receiving the proposal)
  • wording is adapted for different customer segments

The updated templates are uploaded into the CRM, allowing the company to track how changes in proposal structure impact conversion rates and deal closing speed.

As a result, conversion between stages improves, and sales forecasting becomes more accurate.

Sales Forecast Report in CRM: Expected Revenue and Plan Achievement

A sales forecast report in CRM shows expected revenue based on the current deals in the pipeline — taking into account their stages, probability of closing, and planned close dates.

In essence, the system answers a key management question: how much revenue the business can realistically expect to generate in the upcoming period based on the current pipeline.

How Forecasting Is Built in CRM in Practice

For each deal, the system can factor in:

  • deal value
  • pipeline stage
  • closing probability assigned to that stage
  • expected close date

For example, if the pipeline includes:

  • 10 deals worth 100,000 each at the “Commercial Proposal” stage with a 40% closing probability
  • 5 deals worth 200,000 each at the “Negotiation” stage with a 70% probability

the CRM calculates the forecast as follows:

  • 10 × 100,000 × 0.4 = 400,000
  • 5 × 200,000 × 0.7 = 700,000

In the report, the manager sees a projected revenue of 1.1 million for the selected period, broken down by stages, sales reps, or business units.

What Management Decisions Does This Report Enable?

With regular forecast reviews, companies often identify typical issues:

  • deals without an expected close date are automatically excluded from the forecast, understating projected revenue
  • “stalled” deals remain in the pipeline for months, artificially inflating the sales plan

Based on this CRM reporting, the company can:

  • introduce a mandatory “expected close date” field for all deals
  • configure automatic rules to flag inactive deals (for example, no logged activities for more than 14 days)
  • adjust the sales plan and resource allocation, focusing on deals with a high probability of closing within the current period

Top Deals Report in CRM: Focusing on the Opportunities That Drive the Greatest Profit

The Top Deals report in CRM shifts the focus from the number of activities to the deals that have the greatest impact on business profitability. Typically, this includes 10–20% of opportunities that generate the majority of projected revenue and directly influence sales plan achievement.

How the Report Works in Practice

In CRM, filters are configured based on key criteria such as:

  • deal value (for example, deals starting from 300,000)
  • lead source
  • customer segment (enterprise, mid-market, SMB)
  • responsible manager or team

As a result, a manager may see, for example, 15 active deals that account for 60–70% of the expected quarterly revenue.

Example of Management Use

Analytics may reveal that:

  • five of the largest deals came from a single channel (partner referrals)
  • some top deals have remained at the “Negotiation” stage longer than average
  • several high-value deals show minimal activity from the assigned manager

Based on these insights, the company can:

  1. shift the Sales Director’s focus from overseeing the entire pipeline to supporting top-priority deals
  2. involve presales specialists or senior management in strategic negotiations
  3. reallocate marketing investments by strengthening the channels that generate the highest-value clients
  4. proactively identify risks of key contract failure based on specific operational signals (for example, prolonged stagnation at a single pipeline stage, absence or sharp decline in activities, misalignment between deal status and actual actions, changes in the forecasted close date, etc.). This approach makes it possible to respond before these factors impact financial results

Manager Activity Report: Linking Actions to Outcomes

The activity report in CRM shows not only the number of calls, emails, and meetings, but also how managers’ actions influence deal progression through the pipeline.

For the report to work effectively, the company may first define a minimum activity logging standard in CRM. For example:

  • for new leads — first contact within 24 hours
  • for active deals — at least one logged activity per week
  • for key stages — a mandatory call or meeting, not just email communication

The CRM then enables the company to correlate activities with actual sales performance. For example, the report may show that:

  • deals with 2–3 contact points before reaching the negotiation stage have significantly higher conversion rates
  • a high volume of emails without calls correlates with a longer sales cycle
  • managers with fewer but consistently logged activities close deals faster

Based on this analysis, the company can:

  1. refine customer engagement standards (defining which activity types are mandatory at different stages)
  2. identify situations where activity exists but does not generate results
  3. address trends at the team level rather than focusing solely on individual managers

Sales Funnel Conversion Report: From Lead to Signed Contract

The conversion report shows how leads move through the key stages of the funnel — from the first contact to a successful deal. It allows you not to guess why sales are dropping, but to see the specific stage where the process breaks down.

Uses of the report:

  1. Identifying conversion drops due to lead quality — the CRM compares the number of incoming leads with the number of leads that advance to “Opportunity” status.

Example: Out of 300 leads, only 25 become opportunities. This signals that marketing is bringing in traffic that doesn’t match the target customer profile, or that lead sources need to be reviewed.

  1. Diagnosing qualification issues — the report shows at which stage leads most often “stall” or get rejected.

Example: Leads remain in the initial qualification stage for a long time, and managers move them to “Rejected” for various reasons. This indicates the team lacks unified qualification criteria or consistent lead-handling scenarios.

  1. Monitoring CRM data quality — the system tracks deals with missing or incorrectly filled fields, which affect analytics.

Example: A deal moves to “Won” status, but the amount or lead source is not filled in. As a result, the conversion report looks positive, but financial and marketing decisions are based on inaccurate data.

The conversion report allows you to:

  • Make decisions based on facts, not intuition
  • Share responsibility between marketing and sales
  • Scale the funnel without losing control

Lead Source Report in CRM: Performance of Each Marketing Channel

The lead source report allows you to compare acquisition channels not by the number of inquiries, but by their business value: quality, conversion rate, and actual contribution to revenue. It shows which channels should be scaled and which should be reviewed or turned off.

Key Report Capabilities

  1. Data standardization in the CRM — the report works properly only when data is unified: a consistent source/medium logic is used, along with UTM parameters and standardized channel directories. For example, if some leads have the source listed as “Website,” others as “Site,” and some have the field left blank, the CRM cannot accurately calculate channel performance. Standardization provides a single, reliable view and prevents reporting distortions.
  2. Evaluating lead quality, not just volume — CRM reporting allows you to compare sources based on how they move through the funnel: leads → opportunities → deals → revenue.

Example:

  • Facebook Ads generates 120 leads, but only 5 convert into opportunities.
  • Webinars generate just 20 leads, but 8 of them turn into deals.

The report clearly shows that a lower-volume channel can be significantly more profitable for the business.

  1. Marketing investment optimization — based on conversion rates and actual revenue, the CRM helps inform decisions about budget reallocation.

Example: The report shows that SEO leads have a longer sales cycle but a higher average deal value, while paid advertising generates faster but smaller deals. This makes it possible to balance the budget between short-term and long-term growth channels.

The Lead Source Report helps you:

  • Invest your marketing budget strategically
  • Align marketing and sales based on shared data
  • Scale effective channels without compromising lead quality

Service Report in CRM: Monitoring SLA Compliance, Response Speed, and Support Quality

When a CRM system is used not only for sales but also for customer service, these reports become a key tool for quality control. They allow you to evaluate service performance using concrete metrics rather than subjective impressions.

What the Report Can Show:

  1. First Response Time — the CRM records the moment a request is created and the first reply from a manager or support team.

Example: The report shows that the average first response time is 6 hours, while the SLA requires no more than 2 hours. Additional CRM analysis reveals that delays occur outside business hours or when specific team members are overloaded. Based on this insight, the company adjusts shift schedules or configures automated responses.

  1. Resolution Time — the CRM system tracks the full lifecycle of a request, from registration to closure.

Example: CRM data shows that technical requests are resolved in an average of 1 day, while financial requests take 4 days. This signals a need to review processes between the service and finance teams or to introduce a separate request category with priority handling.

  1. Backlog and Request Categories — the report provides visibility not only into the number of open tickets, but also into their structure.

Example: Category analysis shows an increase in requests related to a specific product feature. This may indicate usability issues or insufficient documentation. CRM data then becomes the basis for updating user guides or improving the product.

  1. SLA Compliance — the CRM automatically compares actual performance against SLA terms and flags deviations.

Example: The report shows that 15% of requests from key customers breach SLA due to delayed first responses. The company introduces a priority queue for this segment and sets up automated alerts when there is a risk of SLA violation.

The Service Report enables you to:

  • Monitor support quality in real time
  • Prevent SLA breaches before the customer experiences the impact
  • Increase customer satisfaction and retention through data-driven decisions

Goals and Plans Report: Monitoring Performance in Plan vs. Actual Mode

This report allows you to compare planned targets with actual sales results — both at the team level and for individual managers. It removes subjectivity from performance evaluation and shifts the discussion about goal achievement into the realm of data.

What the report analyzes:

  1. Plan Actual Comparison — the CRM aggregates actual deal data (total closed sales, number of deals, average deal size) and compares it against the set targets.

Example: The report shows that the team achieved 92% of the plan, but 3 managers overperformed while others consistently lag behind. This helps leadership understand that the issue isn’t the overall plan, but uneven workload distribution or differences in individual efficiency.

  1. Breakdown by Role and Period — targets may differ for SDRs, sales managers, and department heads, and the report allows analysis by month or quarter.

Example: CRM data shows that SDRs consistently meet their lead generation targets, but conversion to deals is below expectations. This indicates the need to review lead qualification criteria or handoff processes to sales.

Thus the Goals and Plans Report helps you:

  • Make KPI achievement transparent and measurable
  • Adjust plans proactively rather than “rescue the quarter” in the last week
  • Support management decisions with data rather than intuition

Tasks and Follow-Up Report in CRM: Are Deals Moving Forward?

This type of report shows how deals are progressing. It helps determine whether each lead or deal has a clear next step and whether the team is keeping commitments to customers.

What the report shows:

  1. Planned and Overdue Tasks — the CRM tracks all tasks linked to leads and deals and displays their status.

Example: The report shows that 30% of active deals have overdue follow-ups. This signals that deals are effectively “stalled,” even if they appear active in the pipeline.

  1. Next Steps in Deals — for each deal, you can see whether a next action is planned (call, meeting, document delivery, etc.).

Example: Analysis shows that deals without a planned next step close on average 40% less successfully. Based on this, a CRM rule is introduced: a deal cannot remain without an active task.

  1. Overall Lead Progress — the report allows managers to quickly assess sales momentum without digging into each deal individually.

Example: A manager sees that the number of active deals is growing, but completed tasks are declining. This indicates a risk of accumulating deals without real progress and potential future conversion failure.

The Tasks and Follow-up Report helps you:

  • Keep deals moving forward without manual oversight
  • Reduce the risk of losing customers due to “forgotten” follow-ups
  • Ensure predictable results through process discipline

Request a consultation

CRM KPIs: Which Metrics Truly Impact Company Performance

visualization of effective KPI management in CRM

The effectiveness of a CRM system is not defined by the amount of data collected, but by how well that data supports informed decision-making.

Key performance indicators (KPIs) should be limited in number (3–5 core metrics per role), measurable within the system, and directly tied to revenue or customer satisfaction. Only this approach enables process optimization and sustainable scalability.

Sales KPIs: Individual Performance Metrics

For sales professionals working “in the field,” core KPIs focus on operational discipline and the ability to convert interest into revenue. A CRM system automatically captures the following metrics:

  • Lead Response Time — the time between a lead entering the system and the first contact. This is a critical metric, as customers often buy from the company that responds first. The faster a manager reaches out, the higher the likelihood of conversion.
  • Activity Level — the actual number of calls, meetings, and presentations conducted per day or week. This reflects how proactively the salesperson is moving prospects toward a purchase rather than simply waiting for inbound inquiries.
  • Stage Conversion Rate — the percentage of customers moving from one status to another. This helps identify where a manager is losing audience interest. For example, if a sales representative moves 70% of leads from “Qualification” to “Proposal,” but only 30% advance to “Negotiation,” this signals the need for additional training or adjustments to follow-up scenarios.
  • Average Deal Size — reflects the specialist’s ability to communicate product value and offer additional solutions.
  • Win Rate — the ratio of successfully closed deals to the total number of opportunities handled by an individual specialist.
  • Sales Cycle Length — the time a specific specialist takes to move from first contact to deal closure.

KPI data helps identify where activity translates into results and where processes require optimization. A CRM system converts these metrics into clear reports and dashboards for daily monitoring.

KPIs for Sales Leaders

A Head of Sales focuses not on the details of individual calls, but on the overall health and momentum of the entire department. Their reports and analytics should highlight systemic risks and strategic performance indicators:

  1. Pipeline Coverage — whether the team has a sufficient volume of leads and opportunities to realistically achieve the overall sales target.
  2. Forecast Accuracy — how accurately the team assesses its performance potential (the gap between projected and actual closed revenue).
  3. Sales Team Effectiveness — comparison of performance across different teams, regions, or branches.
  4. Process Bottlenecks — analysis of the stage where the company consistently loses customers, regardless of the individual manager.
  5. Customer Acquisition Cost (CAC) — how cost-effective marketing and sales investments are compared to the revenue generated.

KPIs for Customer Service and Support Teams

In customer service, CRM functionality is focused on retention and maintaining a high standard of service quality. KPI monitoring in this area is primarily based on time-based and quality metrics. Key service KPIs include:

  • SLA Compliance — the percentage of requests handled within the agreed timeframe.
    Example: The CRM shows that 15% of requests from key customers are processed in breach of SLA. This insight enables the team to quickly adjust shift schedules or configure automated reminders to ensure timely responses.
  • First Response Time — how quickly the team reacts to a customer inquiry.
  • Resolution Time — the average time required to close a ticket, helping assess process efficiency.
  • Backlog and Ticket Categories — the number of unresolved requests and their classification.
    Example: An increase in tickets related to delivery delays or billing errors signals the need to optimize logistics or invoicing processes.
  • CSAT (Customer Satisfaction Score) — a metric that measures how satisfied a customer is with a specific interaction or service. Typically, customers are asked to rate their experience on a scale (e.g., 1–5 or 1–10) after contacting support, making a purchase, or using a product.
    Example: After a ticket is closed, the customer receives a short survey. If most ratings are low, this helps identify problematic processes, such as slow response times or an unintuitive product interface.

The CRM system automatically tracks all these metrics, stores historical data, and enables trend analysis — for example, whether customer satisfaction improves after service changes are implemented.

KPIs for Marketing

For marketing, both the quantity and quality of leads matter — along with their impact on sales and overall revenue contribution. Key marketing KPIs tracked in a CRM include:

  • Lead Conversion by Channel — this metric shows how many leads from a specific source progress to the opportunity or deal stage. For example, Facebook Ads, SEO, webinars, or partner programs. Within the CRM, channels can be compared not only by the number of inquiries generated, but by actual performance — specifically, which leads convert into revenue.
  • Customer Acquisition Cost (CAC) — combined with conversion data, CAC helps calculate the ROI of marketing campaigns and determine which investments generate returns and which should be optimized or reallocated.
  • Revenue Contribution — this KPI reflects the real financial impact of marketing activities. The CRM links each lead to a closed deal and the revenue it generated. This makes it possible to identify which channels produce profitable leads and which merely increase traffic without meaningful revenue impact.
  • Sales Cycle by Lead Source — measures the time from first contact to deal closure for leads coming from different channels. This helps identify which channels generate faster wins and which involve longer cycles, enabling better resource planning and sales prioritization.
  • Content and Campaign Effectiveness — tracks which materials or activities move leads forward in the funnel.

Request a consultation

How to Implement CRM Reporting Standards and Bring Order to Data and KPIs — Without Team Resistance

Implementing reporting standards is a management process. The key is to start with foundational rules and gradually build a data-driven culture.

Start with a Minimum Required Data Set

Effective CRM reporting begins with a minimal yet critical set of data — without it, analytics lose their meaning. For each lead or deal, this typically includes:

  • Customer contact details and interaction history (calls, emails, meetings, agreements)
  • Lead source
  • Current status or pipeline stage
  • Assigned specialist
  • Next step and planned action

These fields should be mandatory by default. They form the foundation for reports, KPIs, and overall business analytics.

Standardize Statuses, Stages, and Reference Lists

If your CRM simultaneously includes statuses such as “In Progress,” “Ongoing,” and “Being Processed,” the system cannot calculate performance metrics accurately.

For the CRM to function as a true business performance management tool, you need to:

  1. Approve a unified pipeline stage structure
  2. Standardize loss reasons and deal closure reasons — managers should select from a predefined list rather than entering free-text explanations. This enables accurate analysis of why deals are lost or successfully closed
  3. Standardize lead sources and ticket/request categories

Link KPIs to Actual CRM Actions

The key rule: every KPI must be directly driven by actions performed within the CRM system.

For example:

  • First response time is calculated automatically — from the moment a lead is created to the first recorded interaction with the customer, with no manual tracking required.
  • Sales activity is based on real CRM actions: calls, meetings, and communications logged in the system.
  • Sales target achievement is calculated from actually closed deals in the CRM — not from external spreadsheets or separate files.

Show the Team the Practical Value of Reports

For CRM reporting to become part of daily operations, the team must see clear personal value in it.

In practice, this means:

  1. A sales manager can instantly see which deals require attention today.
  2. A team lead can identify where the funnel is slowing down — and why.
  3. Marketing can see which channels genuinely generate profit.
  4. Service teams can detect potential SLA breach risks before they escalate.

Implement Standards Gradually — Not in One Big Release

CRM reporting is not built overnight. The most effective approach is iterative implementation:

  1. Core data and pipeline
  2. Essential sales reports
  3. Leadership KPIs
  4. Service analytics
  1. Marketing metrics and business intelligence

Request a consultation

Common CRM Reporting Mistakes — and How to Avoid Them

What happens when you have data, KPIs are being calculated, yet the right decisions still don’t follow? Below are common CRM reporting mistakes and practical ways to prevent them.

Duplicate Data and Reporting Chaos

One of the most widespread issues is duplicate leads and customer records. They distort sales metrics and performance KPIs, create the illusion of activity, and prevent a clear understanding of actual business effectiveness.

When Do Duplicates Appear in CRM?

  • Manual data entry by different managers — for example, one manager adds a contact using a shortened name, while another enters the full name or a different email address. The system treats them as two separate customers.
  • Imports from multiple sources without validation — when databases are uploaded from marketing campaigns, websites, or social media, the same lead often enters the system multiple times.
  • No unified customer identification rule — if the CRM does not rely on a clear unique identifier (such as email or phone number), it cannot automatically merge duplicates.
  • Automated integrations without proper configuration — when the CRM is connected to multiple channels (chatbots, website forms, email marketing tools) without deduplication rules, the same customer may be created as a new record each time.

How to avoid it: Set up automated data capture and regular database audit, so the CRM system can track performance metrics without “data noise.”

Undefined Process Stages

When sales pipeline stages lack clear rules, managers don’t fully understand what qualifies as an “active deal” or a “prospect” (a potential customer who has shown interest but has not yet purchased).

How to avoid it: Define clear stage criteria and implement reports with structured categories and real-time KPIs that track the company’s core performance metrics.

“Dead” Activities

Tasks without defined next steps are a strong signal that a deal has effectively stalled. These “dead” activities reduce productivity and lead conversion rates.

How to avoid it: Introduce a rule that no deal can remain without an active task. This helps maintain sales momentum and provides better visibility into sales team effectiveness.

Too Many Dashboards

When a company creates dozens of reports, managers become overwhelmed by data. Instead of enabling decision-making, reporting turns into information noise.

How to avoid it: Streamline your CRM tools and focus only on the core business KPIs — average deal size, lead conversion rate, revenue, customer satisfaction, and others.

No Data Owner

If no one is responsible for data quality, the CRM becomes a storage system rather than a business optimization tool.

How to avoid it: Appoint a data owner within the team who is accountable for reporting accuracy and ensures that performance evaluations are based on reliable data.

Inconsistent Lead Sources

When lead sources are not standardized, the company cannot accurately forecast marketing performance or calculate customer acquisition cost.

How to avoid it: Standardize data collection processes and establish a single source of truth for business analytics.

Ignoring the Customer Dimension

Many reports focus exclusively on sales metrics while overlooking customer satisfaction. Without this perspective, it’s impossible to fully assess the real value of customer interactions.

Solution: Incorporate customer-focused KPIs into your reporting framework to gain a comprehensive view of overall business performance.


Explore the article “‎CRM Reporting in Action: Dashboard Examples in SMART CRM Platform Solutions” to see how reports, KPIs, and analytical dashboards are visualized and used in practice.

If your company aims to maintain full visibility into business performance — from lead movement and team efficiency to marketing channel results — the SMART business team will help you select a CRM solution with powerful analytics, where everything is clear, easy to track, and designed to make process management simple and transparent.

Request a consultation

Index
0%
mail
SMART CRM
Cookies

We use cookies to improve your web experience, display personalized content and analyze traffic. By clicking «Accept All», you agree to their use. To manage your settings, click Settings. Learn more about the use of cookies in the privacy policy.

Functional
Always active
The technical storage or access is strictly necessary for the legitimate purpose of enabling the use of a specific service explicitly requested by the subscriber or user, or for the sole purpose of carrying out the transmission of a communication over an electronic communications network.
Marketing
The technical storage or access is required to create user profiles to send advertising, or to track the user on a website or across several websites for similar marketing purposes.
Statistics
The technical storage or access that is used exclusively for statistical purposes
Analytics
Analytical purposes are used to measure traffic and optimize content.